The yardstick package from tidymodels contains a comprehensive collection of performance metrics for regression and classification models. There are 16 metrics for regression models in the yardstick package. You can use these metrics even if you use other packages for modeling.
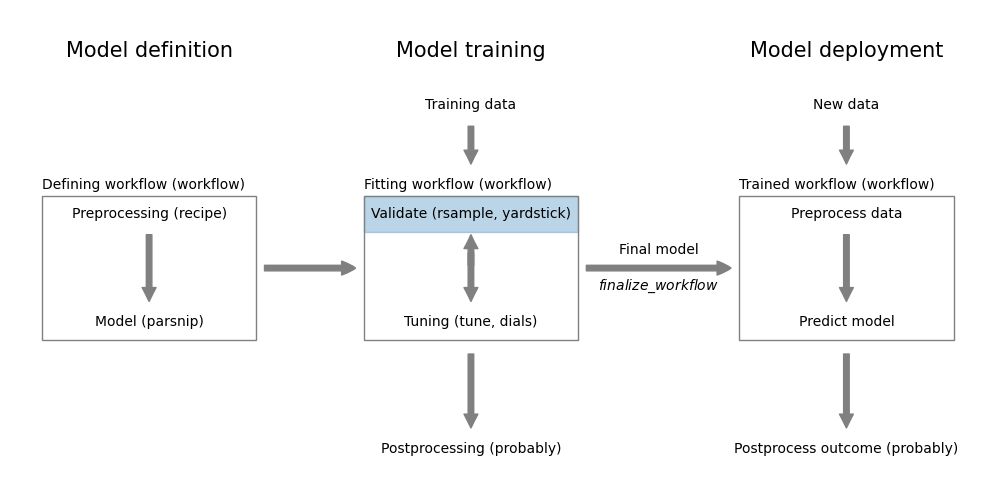
Figure 9.1: Measuring regression performance using yardstick
Figure 9.1 shows how the yardstick package fits into the modeling workflow. After you have trained a regression model, you can use the yardstick package to measure its performance on training data or on new data.
The package is loaded automatically when you load tidymodels.
As described in more detail in Chapter 8, we first build a model for the mtcars dataset.
# preparedata <- datasets::mtcars %>%as_tibble(rownames ="car") %>%mutate(vs =factor(vs, labels =c("V-shaped", "straight")),am =factor(am, labels =c("automatic", "manual")), )# fit modelformula <- mpg ~ cyl + disp + hp + drat + wt + qsec + vs + am + gear + carbmodel <-linear_reg() %>%set_engine("lm") %>%fit(formula, data = data)
9.2 Calculate performance metrics
The yardstick package contains 16 metrics for regression models. The metrics() function calculates the most important metrics for a given model.
metrics(augment(model, data), truth = mpg, estimate = .pred)
# A tibble: 3 × 3
  .metric .estimator .estimate
  <chr>   <chr>          <dbl>
1 rmse    standard       2.15
2 rsq     standard       0.869
3 mae     standard       1.72
We use the parsnip::augment function to add the predictions to the original dataset. For a regression model, this adds prediction (.pred) and residuals (.resid).1 The truth argument specifies the name of the column with the true values, here mpg. The estimate argument specifies the name of the column with the predicted values, here .pred.
The metrics() function calculates the following metrics:
rmse: root mean squared error (RMSE)
rsq: R-squared (R2)
mae: mean absolute error (MAE)
This should be enough for most purposes. If you want to calculate other metrics, you can use the yardstick::metric_set() function. This function takes a list of metrics and returns a function that calculates all metrics in the list. For example, if your dataset has a few outlier values, it can be useful to look at robust metrics like MAE. Here, we combine mae and huber_loss into a custom metric set.
robust_metric <-metric_set(mae, huber_loss)robust_metric(augment(model, data), truth = mpg, estimate = .pred)
# A tibble: 2 × 3
  .metric    .estimator .estimate
  <chr>      <chr>          <dbl>
1 mae        standard        1.72
2 huber_loss standard        1.30