Chapter 8 Training regression models using tidymodels

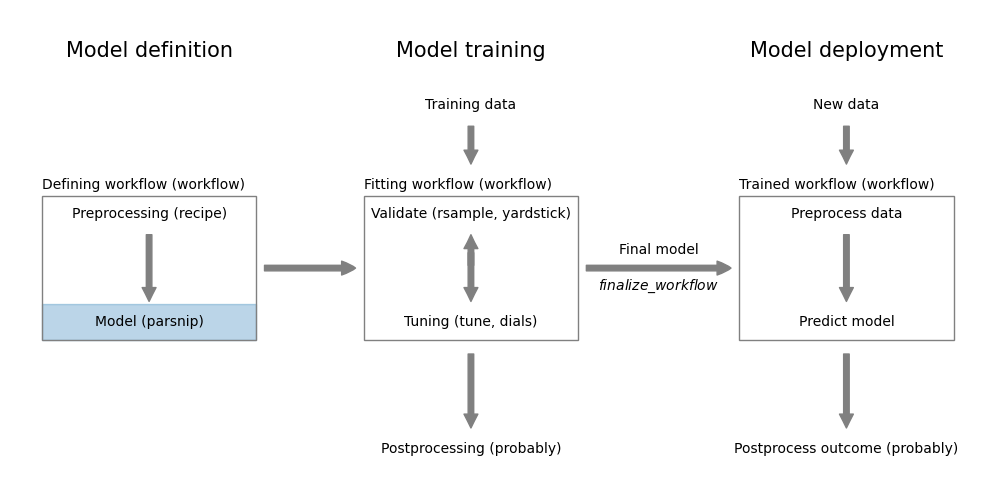
Figure 8.1: Regression model definition using parsnip
Regression models aim to predict a continuous outcome variable from a set of predictor variables. You already learned about linear regression models in your previous class. In this section, we will learn how to define and train models using the parsnip package from tidymodels. First, load all the packages we will need.
8.1 The mtcars dataset
Let’s look at the mtcars dataset. It is distributed with R. We convert it to a tibble and show the first few rows.
## # A tibble: 6 × 11
## mpg cyl disp hp drat wt qsec vs am gear carb
## <dbl> <dbl> <dbl> <dbl> <dbl> <dbl> <dbl> <dbl> <dbl> <dbl> <dbl>
## 1 21 6 160 110 3.9 2.62 16.5 0 1 4 4
## 2 21 6 160 110 3.9 2.88 17.0 0 1 4 4
## 3 22.8 4 108 93 3.85 2.32 18.6 1 1 4 1
## 4 21.4 6 258 110 3.08 3.22 19.4 1 0 3 1
## 5 18.7 8 360 175 3.15 3.44 17.0 0 0 3 2
## 6 18.1 6 225 105 2.76 3.46 20.2 1 0 3 1The mtcars dataset contains 32 observations (rows) and 11 variables (columns); check ?mtcars for details on the dataset. Note that the conversion to a tibble removed the row names. We can preserve the rownames using the rownames keyword in the as_tibble() function.
Several of the variables are categorical variables. Here, we convert vs and am to factors and leave the remaining variables as numbers. We first convert the data frame to a tibble and then mutate these variables to factors.
Code
## # A tibble: 32 × 12
## car mpg cyl disp hp drat wt qsec vs am gear carb
## <chr> <dbl> <dbl> <dbl> <dbl> <dbl> <dbl> <dbl> <fct> <fct> <dbl> <dbl>
## 1 Mazda RX4 21 6 160 110 3.9 2.62 16.5 V-sh… manu… 4 4
## 2 Mazda RX4 … 21 6 160 110 3.9 2.88 17.0 V-sh… manu… 4 4
## 3 Datsun 710 22.8 4 108 93 3.85 2.32 18.6 stra… manu… 4 1
## 4 Hornet 4 D… 21.4 6 258 110 3.08 3.22 19.4 stra… auto… 3 1
## 5 Hornet Spo… 18.7 8 360 175 3.15 3.44 17.0 V-sh… auto… 3 2
## 6 Valiant 18.1 6 225 105 2.76 3.46 20.2 stra… auto… 3 1
## 7 Duster 360 14.3 8 360 245 3.21 3.57 15.8 V-sh… auto… 3 4
## 8 Merc 240D 24.4 4 147. 62 3.69 3.19 20 stra… auto… 4 2
## 9 Merc 230 22.8 4 141. 95 3.92 3.15 22.9 stra… auto… 4 2
## 10 Merc 280 19.2 6 168. 123 3.92 3.44 18.3 stra… auto… 4 4
## # ℹ 22 more rowsWe now have a preprocessed dataset that we can use to build a model to predict mpg using the other variables. To test our model, we create an additional data set with two cars. Note that we apply the same transformations to the new dataset as we did to the training set.
Code
new_cars <- tibble(car = c("test1", "test2"), cyl = c(4, 6),
disp = c(100, 200), hp = c(100, 200), drat = c(3, 4),
wt = c(2, 3), qsec = c(10, 20), vs = c(1, 0),
am = c(1, 0), gear = c(3, 4), carb = c(1, 2)
) %>%
mutate(
vs = factor(vs, labels=c("V-shaped", "straight")),
am = factor(am, labels=c("automatic", "manual")),
)
new_cars## # A tibble: 2 × 11
## car cyl disp hp drat wt qsec vs am gear carb
## <chr> <dbl> <dbl> <dbl> <dbl> <dbl> <dbl> <fct> <fct> <dbl> <dbl>
## 1 test1 4 100 100 3 2 10 straight manual 3 1
## 2 test2 6 200 200 4 3 20 V-shaped automatic 4 28.2 Predicting mpg in the mtcars dataset using tidymodels
Here is how we train a linear regression model using tidymodels. The formula specifies the outcome variable and the predictor variables. The formula is defined as outcome ~ predictor1 + predictor2 + ....4 In our case, we want to predict mpg using all the other variables. We could specify this as mpg~.. The . means all the other variables. However, it is better to explicitly list the predictors to avoid mistakes.
Code
The linear_reg() function specifies that we want to train a linear regression model. The set_engine() function defines the actual model. Here it will be the lm model from base-R. We could also use set_engine("glm") to use the glm function from base-R.
The fit() function trains the model. The result is an object of class linear_reg. Printing the model gives details about the model.
## parsnip model object
##
##
## Call:
## stats::lm(formula = mpg ~ cyl + disp + hp + drat + wt + qsec +
## vs + am + gear + carb, data = data)
##
## Coefficients:
## (Intercept) cyl disp hp drat wt
## 12.30337 -0.11144 0.01334 -0.02148 0.78711 -3.71530
## qsec vsstraight ammanual gear carb
## 0.82104 0.31776 2.52023 0.65541 -0.19942We can also access the actual model using model$fit.
##
## Call:
## stats::lm(formula = mpg ~ cyl + disp + hp + drat + wt + qsec +
## vs + am + gear + carb, data = data)
##
## Coefficients:
## (Intercept) cyl disp hp drat wt
## 12.30337 -0.11144 0.01334 -0.02148 0.78711 -3.71530
## qsec vsstraight ammanual gear carb
## 0.82104 0.31776 2.52023 0.65541 -0.19942As is usual in R for predictive models, we can use the predict() function to predict mpg for new data.
## # A tibble: 2 × 1
## .pred
## <dbl>
## 1 18.8
## 2 20.7The predict() function returns a tibble with the predicted values. At first glance, it seems that it would be unnecessary to return a tibble. However, predict can return additional information, so returning a tibble in this simple case is more consistent.
Useful to know:
The parsnip::augment function is shortcut to predict a dataset and return a new tibble that includes the predicted values.
## # A tibble: 2 × 12
## .pred car cyl disp hp drat wt qsec vs am gear carb
## <dbl> <chr> <dbl> <dbl> <dbl> <dbl> <dbl> <dbl> <fct> <fct> <dbl> <dbl>
## 1 18.8 test1 4 100 100 3 2 10 straight manual 3 1
## 2 20.7 test2 6 200 200 4 3 20 V-shaped automatic 4 2The predicted values are added as the new column .pred. If the dataset contains a column with the actual values, the predicted values are compared to the actual values and the difference is added as the new column .resid.5 The prefix . is used as an indicator for derived columns. It also helps to avoid name clashes with existing columns.
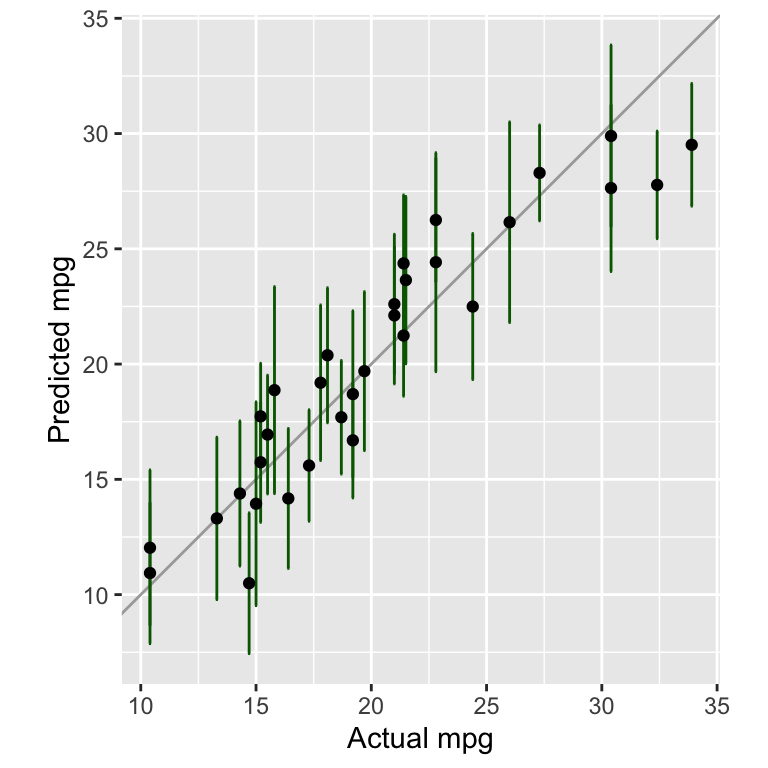
Figure 8.2 shows the actual mpg values against the predicted values for the training data.
Code
pred_ci <- predict(model, new_data=data, type="conf_int")
df <- tibble(
actual=data$mpg,
predicted=predict(model, new_data=data)$.pred,
lower=pred_ci$.pred_lower,
upper=pred_ci$.pred_upper)
ggplot(df, aes(x=actual, y=predicted, ymin=lower, ymax=upper)) +
geom_abline(color="darkgrey") +
geom_errorbar(color="darkgreen") +
geom_point() +
labs(x="Actual mpg", y="Predicted mpg") +
coord_fixed(ratio=1)
Figure 8.2: Comparing actual against predicted mpg values for the tidymodels model
In Figure 8.2, we added error bars to show the confidence interval of the predictions. They were calculated using the command predict(model, new_data=data, type="conf_int").
Further information:
The tidymodels package parsnip is the package that is responsible to define and fit models. You find detailed information about each of the model types, the specific engines and their options in the documentation.
- https://parsnip.tidymodels.org/ is the documentation for the
parsnippackage. - https://parsnip.tidymodels.org/reference/index.html lists all the different model types that are available in
parsnip - https://parsnip.tidymodels.org/reference/linear_reg.html is the documentation for the
linear_reg()function. Here, you find a list of all the engines that can be used withlinear_reg(). - https://parsnip.tidymodels.org/reference/details_linear_reg_lm.html is the documentation for the
lmengine. These specific pages will give you more details about the different options that are available for each model.
Code
The code of this chapter is summarized here.
Code
knitr::opts_chunk$set(echo=TRUE, cache=TRUE, autodep=TRUE, fig.align="center")
knitr::include_graphics("images/model_workflow_parsnip.png")
library(tidyverse)
library(tidymodels)
data <- datasets::mtcars %>%
    as_tibble()
head(data)
data <- datasets::mtcars %>%
    as_tibble(rownames="car") %>%
    mutate(
        vs = factor(vs, labels=c("V-shaped", "straight")),
        am = factor(am, labels=c("automatic", "manual")),
    )
data
new_cars <- tibble(car = c("test1", "test2"), cyl = c(4, 6),
                   disp = c(100, 200), hp = c(100, 200), drat = c(3, 4),
                   wt = c(2, 3), qsec = c(10, 20), vs = c(1, 0),
                   am = c(1, 0), gear = c(3, 4), carb = c(1, 2)
    ) %>%
    mutate(
        vs = factor(vs, labels=c("V-shaped", "straight")),
        am = factor(am, labels=c("automatic", "manual")),
    )
new_cars
formula <- mpg ~ cyl + disp + hp + drat + wt + qsec + vs + am + gear + carb
model <- linear_reg() %>%
    set_engine("lm") %>%
    fit(formula, data=data)
model
model$fit
predict(model, new_data=new_cars)
augment(model, new_data=new_cars)
pred_ci <- predict(model, new_data=data, type="conf_int")
df <- tibble(
    actual=data$mpg,
    predicted=predict(model, new_data=data)$.pred,
    lower=pred_ci$.pred_lower,
    upper=pred_ci$.pred_upper)

ggplot(df, aes(x=actual, y=predicted, ymin=lower, ymax=upper)) +
    geom_abline(color="darkgrey") +
    geom_errorbar(color="darkgreen") +
    geom_point() +
    labs(x="Actual mpg", y="Predicted mpg") +
    coord_fixed(ratio=1)