Chapter 13 Validating models
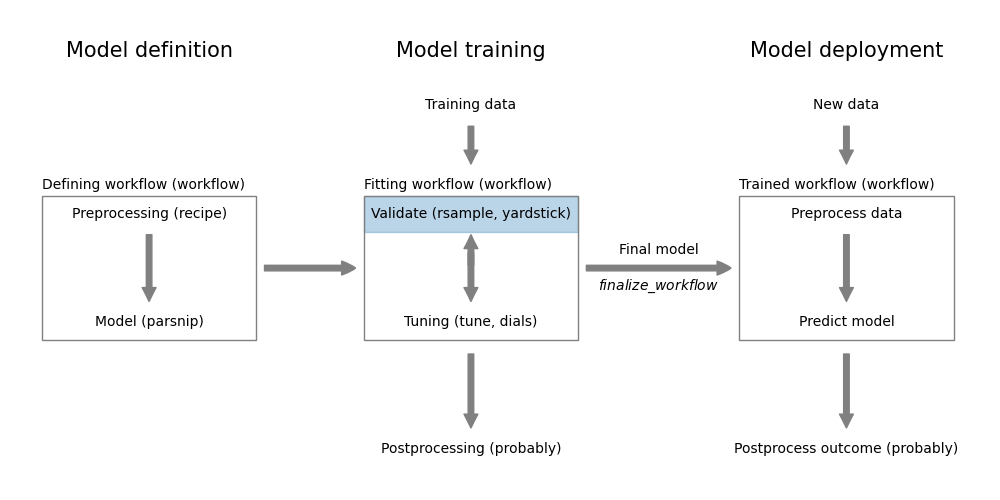
Figure 13.1: Model validation
In Chapter 12, we covered various ways of splitting the data into subsets. In this chapter, we will use these subsets to assess model performance for model validation using:
- a holdout set,
- cross-validation, and
- bootstrapping.
Load required packages:
and setup the parallel backend for faster processing (see Appendix 29.1 for details):
13.1 Model validation using holdout set
In the following we demonstrate how to use a holdout set to assess the performance of a regression model to predict mileage for cars.
Code
# Load an preprocess the data
data <- datasets::mtcars %>%
as_tibble(rownames="car") %>%
mutate(
vs = factor(vs, labels=c("V-shaped", "straight")),
am = factor(am, labels=c("automatic", "manual")),
)
# Split the data into training and test/holdout sets
set.seed(1353)
car_split <- initial_split(mtcars)
train_data <- training(car_split)
holdout_data <- testing(car_split)
# Train a model using the training set
formula <- mpg ~ cyl + disp + hp + drat + wt + qsec + vs + am + gear + carb
model <- linear_reg() %>%
set_engine("lm") %>%
fit(formula, data=train_data)We now have a trained model and can use it to assess model performance for the training and holdout set using the default regression metrics from yardstick.
Code
We can combine the performance metrics for the training and holdout set into a single table for comparison.
Code
| data | rmse | rsq | mae |
|---|---|---|---|
| Training | 2.06 | 0.90 | 1.62 |
| Holdout | 3.10 | 0.74 | 2.78 |
The performance metrics on the training set indicate better performance compared to the holdout set. This is expected since the model was trained on the training set.
13.2 Model validation using cross-validation
We will now use cross-validation to assess model performance. This time, we train a logistic regression model for the Universal Bank dataset using the entire dataset and use cross-validation to assess model performance. First download the dataset and preprocess it.
Code
# Load and preprocess the data
data <- read_csv("https://gedeck.github.io/DS-6030/datasets/UniversalBank.csv.gz")
data <- data %>%
select(-c(ID, `ZIP Code`)) %>%
rename(
Personal.Loan = `Personal Loan`,
Securities.Account = `Securities Account`,
CD.Account = `CD Account`
) %>%
mutate(
Personal.Loan = factor(Personal.Loan, labels=c("Yes", "No"), levels=c(1, 0)),
Education = factor(Education, labels=c("Undergrad", "Graduate", "Advanced")),
)Now we setup and execute the cross-validation.
Code
# Use 10-fold cross-validation to assess model performance
set.seed(1353)
folds <- vfold_cv(data, strata=Personal.Loan)
# define the model
formula <- Personal.Loan ~ Age + Experience + Income + Family + CCAvg + Education +
Mortgage + Securities.Account + CD.Account + Online +
CreditCard
logreg_model <- logistic_reg() %>%
set_engine("glm")
# define and execute the cross-validation workflow
logreg_wf <- workflow() %>%
add_model(logreg_model) %>%
add_formula(formula)
logreg_fit_cv <- logreg_wf %>%
fit_resamples(folds)This is all we need to do. We first define our resampling approach using the function vfold_cv passing in the dataset and information about the column we want to use for stratified sampling, the outcome variable Personal.Loan. The default v=10 is used to define a 10-fold cross validation. Next we setup our model and define the formulat to use for training. Finaly, we combine the model and formula into a workflow and use the fit_resamples function to execute the cross-validation. The results are stored in the logreg_fit_cv object. Let’s have a look at it:
## # Resampling results
## # 10-fold cross-validation using stratification
## # A tibble: 10 × 4
## splits id .metrics .notes
## <list> <chr> <list> <list>
## 1 <split [4500/500]> Fold01 <tibble [3 × 4]> <tibble [0 × 3]>
## 2 <split [4500/500]> Fold02 <tibble [3 × 4]> <tibble [0 × 3]>
## 3 <split [4500/500]> Fold03 <tibble [3 × 4]> <tibble [0 × 3]>
## 4 <split [4500/500]> Fold04 <tibble [3 × 4]> <tibble [0 × 3]>
## 5 <split [4500/500]> Fold05 <tibble [3 × 4]> <tibble [0 × 3]>
## 6 <split [4500/500]> Fold06 <tibble [3 × 4]> <tibble [0 × 3]>
## 7 <split [4500/500]> Fold07 <tibble [3 × 4]> <tibble [0 × 3]>
## 8 <split [4500/500]> Fold08 <tibble [3 × 4]> <tibble [0 × 3]>
## 9 <split [4500/500]> Fold09 <tibble [3 × 4]> <tibble [0 × 3]>
## 10 <split [4500/500]> Fold10 <tibble [3 × 4]> <tibble [0 × 3]>It’s not very informative. logreg_fit_cv is a tibble where each row corresponds to models trained for each fold (column id).8 Information about what was used at each iteration is in the splits column. The performance on the out-of-fold validation set is in the .metrics column.
We can now use the collect_metrics function to extract information about the performance metrics for each fold. By default it will summarize the information for each metric into a mean and standard error.
## # A tibble: 3 × 6
## .metric .estimator mean n std_err .config
## <chr> <chr> <dbl> <int> <dbl> <chr>
## 1 accuracy binary 0.958 10 0.00184 Preprocessor1_Model1
## 2 brier_class binary 0.0322 10 0.00123 Preprocessor1_Model1
## 3 roc_auc binary 0.961 10 0.00502 Preprocessor1_Model1We can see that during cross-validation, the model performance is evaluated using accuracy and the AUC under the ROC curve. The metrics are combined into a mean and an associated standard deviation.
By default, individual predictions on the out-of-fold dataset for the performance metrics are not returned. If we want to keep these for further analysis, we need to add a control statement to the fit_resamples call.
The control_resamples function returns the is used to pass additional arguments to the fit_resamples function. Here, we override the default behavior by setting save_pred=TRUE which instructs the function to preserve the out-of-fold predictions for each fold. The collect_predictions function returns a tibble with all predictions for each fold.
## # A tibble: 5,000 × 7
## .pred_class .pred_Yes .pred_No id .row Personal.Loan .config
## <fct> <dbl> <dbl> <chr> <int> <fct> <chr>
## 1 No 0.0175 0.982 Fold01 7 No Preprocessor1_Mode…
## 2 No 0.0490 0.951 Fold01 25 No Preprocessor1_Mode…
## 3 No 0.0123 0.988 Fold01 28 No Preprocessor1_Mode…
## 4 Yes 0.785 0.215 Fold01 30 Yes Preprocessor1_Mode…
## 5 No 0.00122 0.999 Fold01 31 No Preprocessor1_Mode…
## 6 No 0.00517 0.995 Fold01 47 No Preprocessor1_Mode…
## 7 No 0.00142 0.999 Fold01 59 No Preprocessor1_Mode…
## 8 Yes 0.654 0.346 Fold01 60 No Preprocessor1_Mode…
## 9 No 0.0113 0.989 Fold01 74 No Preprocessor1_Mode…
## 10 No 0.000650 0.999 Fold01 88 No Preprocessor1_Mode…
## # ℹ 4,990 more rowsWe can use this information to calculate a ROC curves on the out-of-fold predictions.
Code
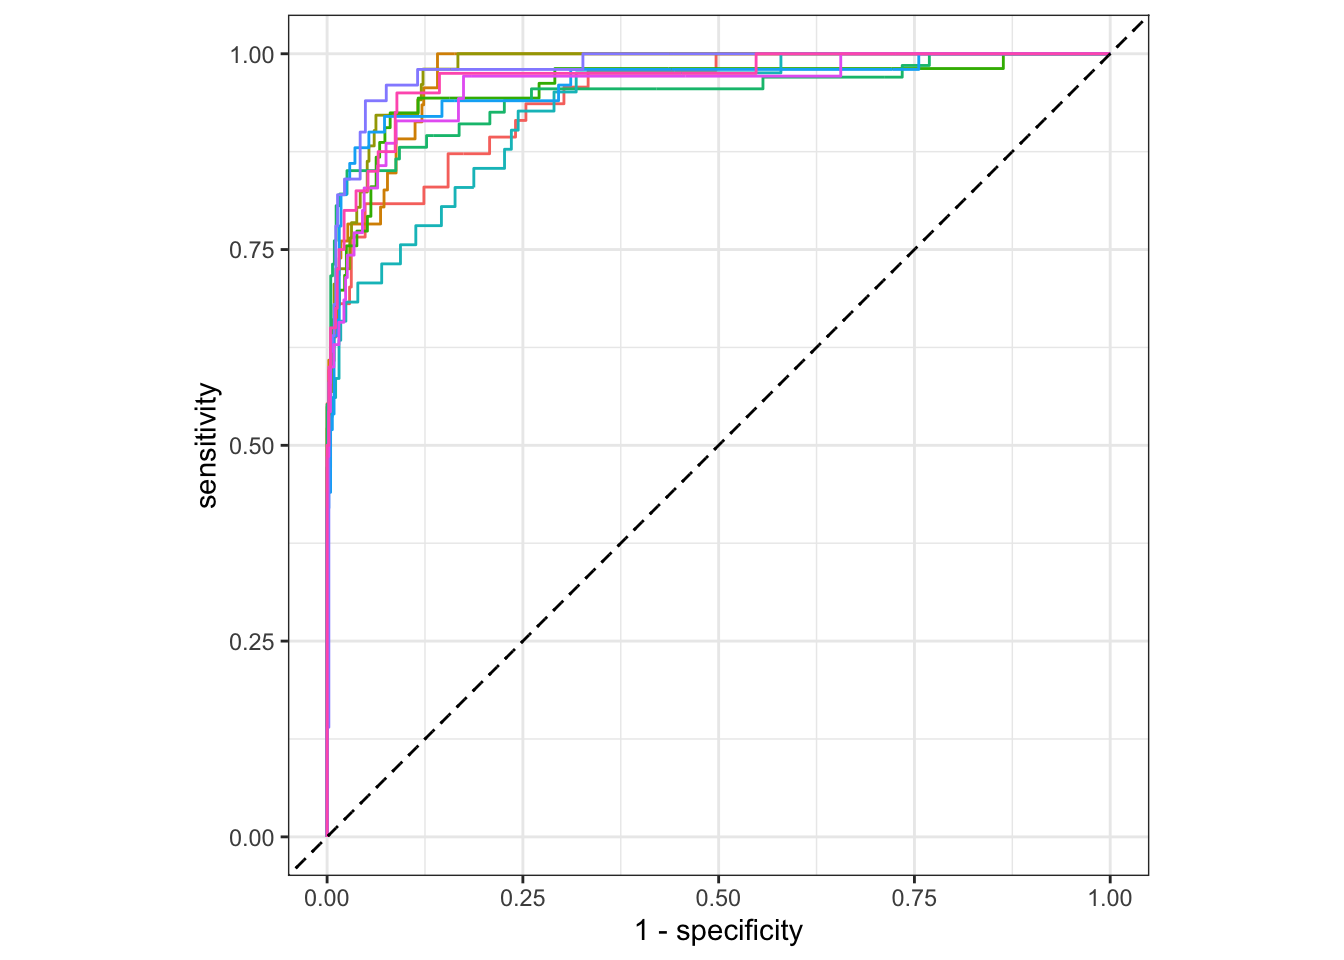
Figure 13.2: Individual ROC curves for cross-validation folds
Instead of showing individual ROC curves for each fold, we can also combine them into a single plot. Figure 13.3 compares the ROC curves for the cross-validation predictions and the predictions on the training set.
Code
# Train a model on the full dataset
full_model <- logistic_reg() %>%
set_engine("glm") %>%
fit(formula, data=data)
cv_roc <- cv_predictions %>%
roc_curve(truth=Personal.Loan, .pred_Yes, event_level="first")
ontrain_roc <- augment(full_model, new_data=data) %>%
roc_curve(Personal.Loan, .pred_Yes, event_level="first")
ggplot() +
geom_path(data=cv_roc, aes(x=1 - specificity, y=sensitivity)) +
geom_path(data=ontrain_roc, aes(x=1 - specificity, y=sensitivity), color="red") +
geom_abline(lty=2)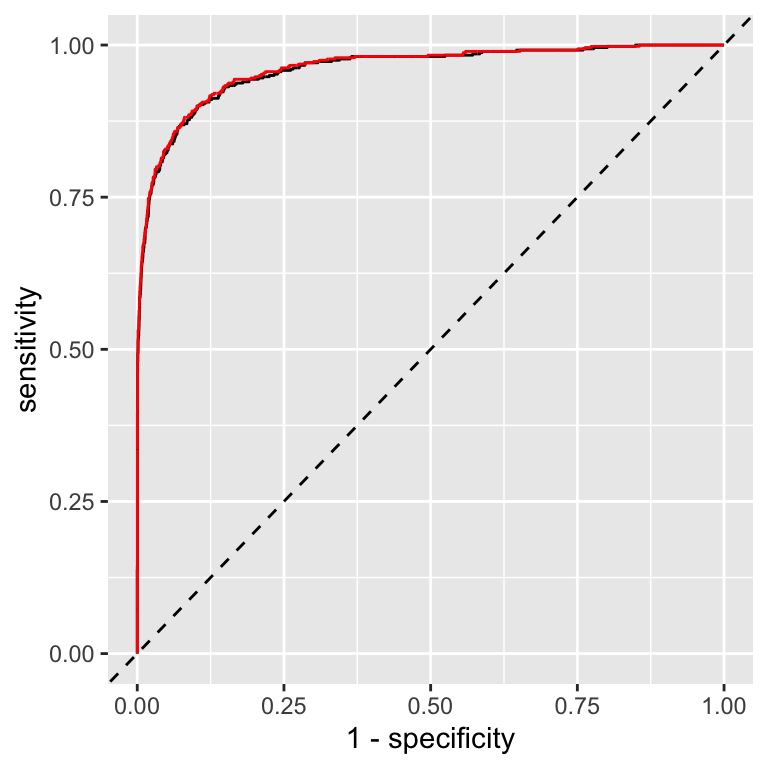
Figure 13.3: Comparison of ROC curves for cross-validation predictions (black) and on-training set predictions (red)
The ROC curves for the cross-validation predictions are very similar to the ROC curves for the predictions on the training set. This indicates that the model is not overfitting the training data.
13.3 Model validation using bootstrapping
The bootstraps function from the rsample package can be used to generate bootstrap samples.9 We can use these to assess model performance using bootstrap resampling. This time, we train a nearest neighbor model (see appendix 27.5) for the Universal Bank dataset. Because the kknn package supports both classification and regression, we need to specify the type of model we want to train.
Code
# Use bootstrap to assess model performance
set.seed(1353)
resamples <- rsample::bootstraps(data)
# define the model
formula <- Personal.Loan ~ Age + Experience + Income + Family + CCAvg + Education +
Mortgage + Securities.Account + CD.Account + Online +
CreditCard
nn_model <- nearest_neighbor(neighbors=5) %>%
set_mode("classification") %>%
set_engine("kknn")
# define and execute the cross-validation workflow
nn_wf <- workflow() %>%
add_model(nn_model) %>%
add_formula(formula)
nn_fit_boot <- nn_wf %>%
fit_resamples(resamples, control=control_resamples(save_pred=TRUE))If you compare the code for bootstrap sampling with the code for cross-validation, you will notice that the only difference is the call to bootstraps instead of vfold_cv and the use of a different model. The rest of the code is identical.
Let’s have a look at the results.
## # Resampling results
## # Bootstrap sampling
## # A tibble: 25 × 5
## splits id .metrics .notes .predictions
## <list> <chr> <list> <list> <list>
## 1 <split [5000/1846]> Bootstrap01 <tibble [3 × 4]> <tibble> <tibble>
## 2 <split [5000/1809]> Bootstrap02 <tibble [3 × 4]> <tibble> <tibble>
## 3 <split [5000/1874]> Bootstrap03 <tibble [3 × 4]> <tibble> <tibble>
## 4 <split [5000/1835]> Bootstrap04 <tibble [3 × 4]> <tibble> <tibble>
## 5 <split [5000/1845]> Bootstrap05 <tibble [3 × 4]> <tibble> <tibble>
## 6 <split [5000/1856]> Bootstrap06 <tibble [3 × 4]> <tibble> <tibble>
## 7 <split [5000/1839]> Bootstrap07 <tibble [3 × 4]> <tibble> <tibble>
## 8 <split [5000/1841]> Bootstrap08 <tibble [3 × 4]> <tibble> <tibble>
## 9 <split [5000/1859]> Bootstrap09 <tibble [3 × 4]> <tibble> <tibble>
## 10 <split [5000/1834]> Bootstrap10 <tibble [3 × 4]> <tibble> <tibble>
## # ℹ 15 more rows
##
## There were issues with some computations:
##
## - Warning(s) x25: variable '..y' is absent, its contrast will be ignored
##
## Run `show_notes(.Last.tune.result)` for more information.Again, this is not very informative. We have 25 bootstrap samples and various columns that contain information about each sample. Because we used save_pred=TRUE in the fit_resamples call, we also have the .predictions column with the individual predictions.
We can use collect_metrics to extract the performance metrics for each fold and compare the result to the cross-validation results for the logistic regression model.10
Code
boot_metrics <- collect_metrics(nn_fit_boot)
bind_rows(cv_metrics %>% mutate(model="Logistic regression"),
boot_metrics %>% mutate(model="Nearest neighbor")) %>%
select(model, mean, .metric) %>%
pivot_wider(names_from=.metric, values_from=mean) %>%
knitr::kable(digits = 3) %>%
kableExtra::kable_styling(full_width=FALSE)| model | accuracy | brier_class | roc_auc |
|---|---|---|---|
| Logistic regression | 0.958 | 0.032 | 0.961 |
| Nearest neighbor | 0.961 | 0.032 | 0.918 |
Base on accuracy, we would conclude that the nearest neighbor model is better than the logistic regression model. However, the AUC for the nearest neighbor model is significantly lower.
Let’s see if this is reflected in the ROC curves of the two models. Figure 13.4 compares the ROC curves for the bootstrap predictions and the predictions on the training set.
Code
# Train a model on the full dataset
full_model <- nn_wf %>% fit(data)
boot_roc <- collect_predictions(nn_fit_boot) %>%
roc_curve(truth=Personal.Loan, .pred_Yes, event_level="first")
ontrain_roc <- augment(full_model, new_data=data) %>%
roc_curve(Personal.Loan, .pred_Yes, event_level="first")
ggplot() +
geom_path(data=boot_roc, aes(x=1 - specificity, y=sensitivity)) +
geom_path(data=ontrain_roc, aes(x=1 - specificity, y=sensitivity), color="red") +
geom_path(data=cv_roc, aes(x=1 - specificity, y=sensitivity), color="grey") +
geom_abline(lty=2)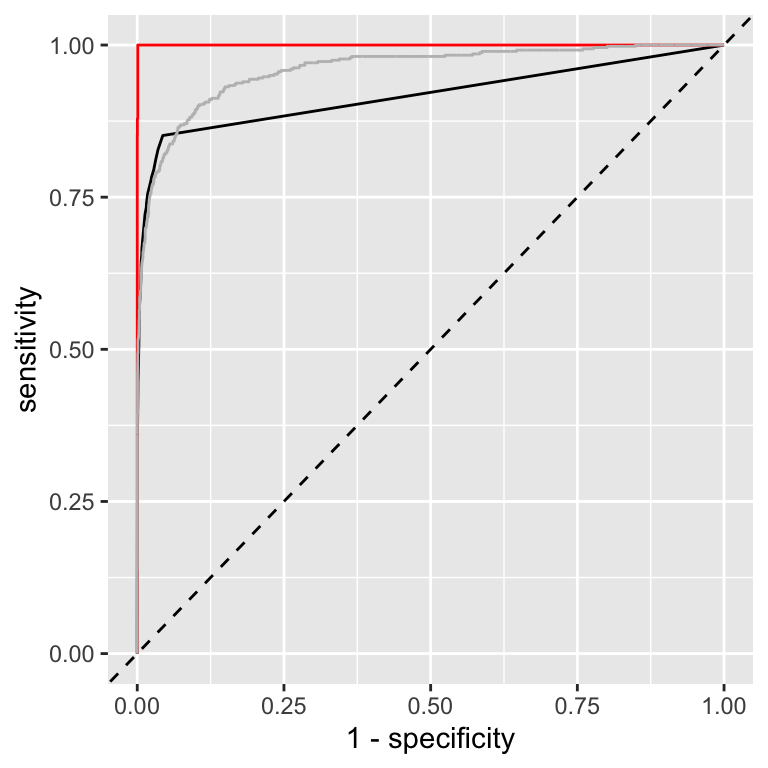
Figure 13.4: Comparison of ROC curves for bootstrap predictions (black) and on-training set predictions (red) for a nearest-neighbor model. For comparison, the ROC curve for the logistic regression model is overlaid as well in grey.
Let’s first compare the ROC curves for the bootstrap predictions and the predictions on the training set. The ROC curves for prediction of the full model on the training set (red curve) represents an ideal model, i.e. every data point is correctly predicted. This is expected for a nearest neighbor model. This observations emphasizes the importance of using a holdout set or cross-validation to assess model performance.
The ROC curve for the bootstrap predictions (black curve) is more realistic. It is similar to the ROC curve for the cross-validation predictions (grey curve). However, we can also see that at the beginning, the ROC curve for the bootstrap predictions is below the ROC curve for the cross-validation predictions. This confirms what we’ve seen from the AUC values. However, we have not explored different numbers of neighbors. In fact, as we will see in Section 15.4, increasing the number of neighbors will improve the performance of the nearest neighbor model and ultimately result in a model that has a better ROC curve compared to the logistic regression model.
13.3.1 Distribution of metrics for bootstrap samples
We can also use the bootstrap samples to assess the distribution of the performance metrics. In this case, it is however better to increase the number of resamples. Here, we use 1000 bootstrap samples.
Code
We repeat the bootstrap validation more times. By default, if we call collect_metrics we get mean and standard error for each metric.
## # A tibble: 3 × 6
## .metric .estimator mean n std_err .config
## <chr> <chr> <dbl> <int> <dbl> <chr>
## 1 accuracy binary 0.961 1000 0.000131 Preprocessor1_Model1
## 2 brier_class binary 0.0329 1000 0.000102 Preprocessor1_Model1
## 3 roc_auc binary 0.913 1000 0.000428 Preprocessor1_Model1However, if we use the summarize=FALSE argument, we get the performance metrics calculated for each bootstrap sample.
## # A tibble: 6 × 5
## id .metric .estimator .estimate .config
## <chr> <chr> <chr> <dbl> <chr>
## 1 Bootstrap0001 accuracy binary 0.956 Preprocessor1_Model1
## 2 Bootstrap0001 roc_auc binary 0.917 Preprocessor1_Model1
## 3 Bootstrap0001 brier_class binary 0.0350 Preprocessor1_Model1
## 4 Bootstrap0002 accuracy binary 0.953 Preprocessor1_Model1
## 5 Bootstrap0002 roc_auc binary 0.906 Preprocessor1_Model1
## 6 Bootstrap0002 brier_class binary 0.0364 Preprocessor1_Model1This allows us to calculate the distribution of the performance metrics. Figure 13.5 shows the distribution of the two metrics for the bootstrap samples.
Code
quantiles <- nn_fit_boot %>%
collect_metrics(summarize=FALSE) %>%
group_by(.metric) %>%
summarize(
q0.025 = quantile(.estimate, 0.025),
median = quantile(.estimate, 0.5),
q0.975 = quantile(.estimate, 0.975)
)
nn_fit_boot %>%
collect_metrics(summarize=FALSE) %>%
ggplot(aes(x=.estimate)) +
geom_histogram(bins=50) +
facet_wrap(~.metric, scales="free") +
geom_vline(data=quantiles, aes(xintercept=median), color="blue") +
geom_vline(data=quantiles, aes(xintercept=q0.025), color="blue", linetype="dashed") +
geom_vline(data=quantiles, aes(xintercept=q0.975), color="blue", linetype="dashed")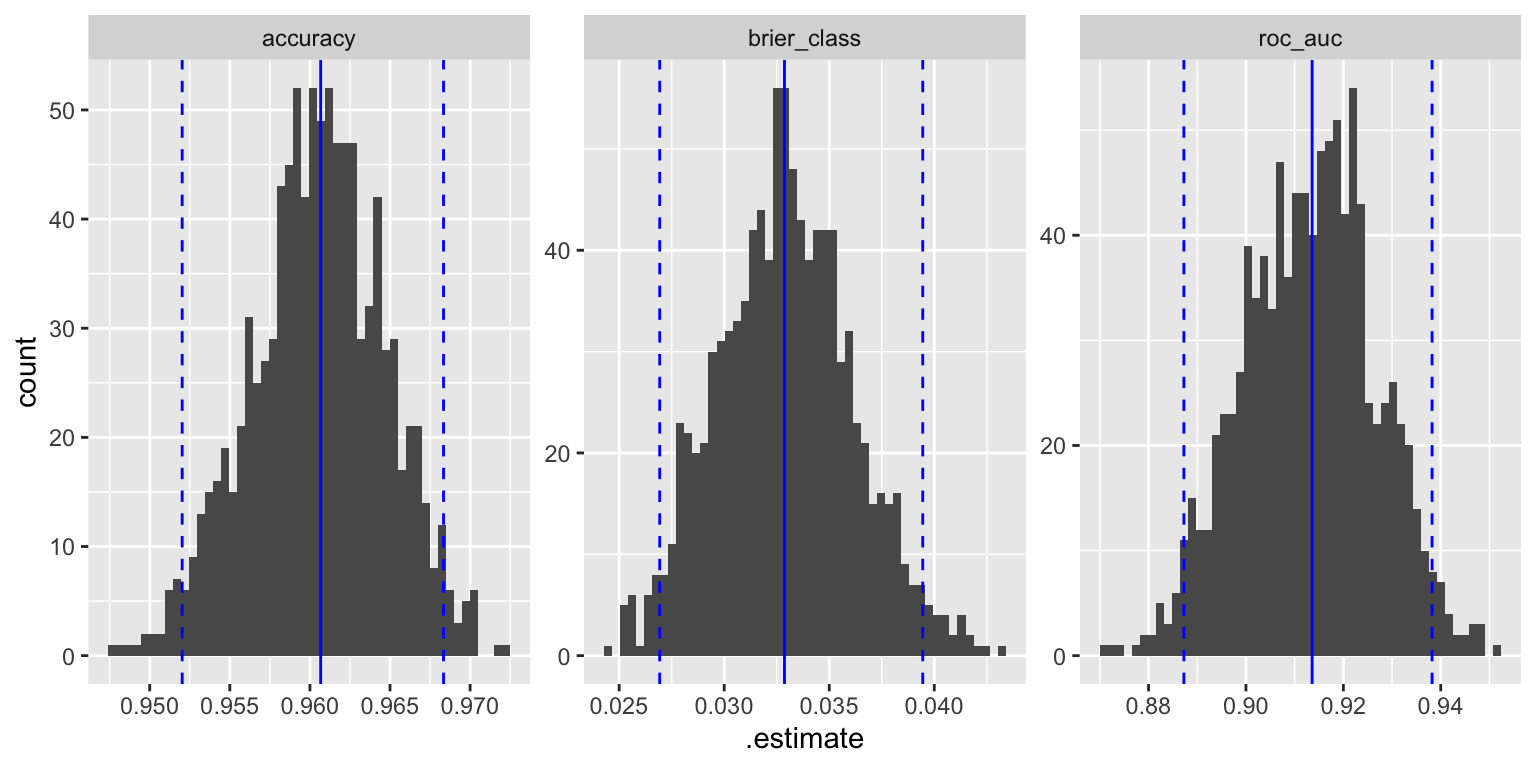
Figure 13.5: Distribution of performance metrics for bootstrap samples; the blue lines show the median and the 95% confidence interval
Further information:
- https://tune.tidymodels.org/reference/control_grid.html control the execution of the
fit_resamplesfunction
Code
The code of this chapter is summarized here.
Code
knitr::opts_chunk$set(echo=TRUE, cache=TRUE, autodep=TRUE, fig.align="center")
knitr::include_graphics("images/model_workflow_validate.png")
library(tidyverse)
library(tidymodels)
library(patchwork)
library(future)
plan(multisession, workers = parallel::detectCores(logical = FALSE))
# Load an preprocess the data
data <- datasets::mtcars %>%
    as_tibble(rownames="car") %>%
    mutate(
        vs = factor(vs, labels=c("V-shaped", "straight")),
        am = factor(am, labels=c("automatic", "manual")),
    )

# Split the data into training and test/holdout sets
set.seed(1353)
car_split <- initial_split(mtcars)
train_data <- training(car_split)
holdout_data <- testing(car_split)

# Train a model using the training set
formula <- mpg ~ cyl + disp + hp + drat + wt + qsec + vs + am + gear + carb
model <- linear_reg() %>%
    set_engine("lm") %>%
    fit(formula, data=train_data)
perf_train <- augment(model, new_data=train_data) %>%
    metrics(truth=mpg, estimate=.pred) %>%
    mutate(data="Training")
perf_holdout <- augment(model, new_data=holdout_data) %>%
    metrics(truth=mpg, estimate=.pred) %>%
    mutate(data="Holdout")
bind_rows(perf_train, perf_holdout) %>%  # combine the two results
    select(data, .estimate, .metric) %>%  # select the columns of interest
    pivot_wider(names_from=.metric, values_from=.estimate) %>%  # convert to wide format
    knitr::kable(digits = 2) %>%
    kableExtra::kable_styling(full_width=FALSE)
# Load and preprocess the data
data <- read_csv("https://gedeck.github.io/DS-6030/datasets/UniversalBank.csv.gz")
data <- data %>%
    select(-c(ID, `ZIP Code`)) %>%
    rename(
        Personal.Loan = `Personal Loan`,
        Securities.Account = `Securities Account`,
        CD.Account = `CD Account`
    ) %>%
    mutate(
        Personal.Loan = factor(Personal.Loan, labels=c("Yes", "No"), levels=c(1, 0)),
        Education = factor(Education, labels=c("Undergrad", "Graduate", "Advanced")),
    )
# Use 10-fold cross-validation to assess model performance
set.seed(1353)
folds <- vfold_cv(data, strata=Personal.Loan)

# define the model
formula <- Personal.Loan ~ Age + Experience + Income + Family + CCAvg + Education +
                           Mortgage + Securities.Account + CD.Account + Online +
                           CreditCard
logreg_model <- logistic_reg() %>%
    set_engine("glm")

# define and execute the cross-validation workflow
logreg_wf <- workflow() %>%
    add_model(logreg_model) %>%
    add_formula(formula)

logreg_fit_cv <- logreg_wf %>%
    fit_resamples(folds)
logreg_fit_cv
cv_metrics <- collect_metrics(logreg_fit_cv)
cv_metrics
logreg_fit_cv <- logreg_wf %>%
    fit_resamples(folds, control=control_resamples(save_pred=TRUE))
cv_predictions <- collect_predictions(logreg_fit_cv)
cv_predictions
cv_predictions %>%
    group_by(id) %>%
    roc_curve(truth=Personal.Loan, .pred_Yes, event_level="first") %>%
autoplot() +
    geom_abline(lty=2) +
    theme(legend.position="none")
# Train a model on the full dataset
full_model <- logistic_reg() %>%
    set_engine("glm") %>%
    fit(formula, data=data)

cv_roc <- cv_predictions %>%
    roc_curve(truth=Personal.Loan, .pred_Yes, event_level="first")

ontrain_roc <- augment(full_model, new_data=data) %>%
    roc_curve(Personal.Loan, .pred_Yes, event_level="first")

ggplot() +
    geom_path(data=cv_roc, aes(x=1 - specificity, y=sensitivity)) +
    geom_path(data=ontrain_roc, aes(x=1 - specificity, y=sensitivity), color="red") +
    geom_abline(lty=2)
# Use bootstrap to assess model performance
set.seed(1353)
resamples <- rsample::bootstraps(data)

# define the model
formula <- Personal.Loan ~ Age + Experience + Income + Family + CCAvg + Education +
                           Mortgage + Securities.Account + CD.Account + Online +
                           CreditCard
nn_model <- nearest_neighbor(neighbors=5) %>%
    set_mode("classification") %>%
    set_engine("kknn")

# define and execute the cross-validation workflow
nn_wf <- workflow() %>%
    add_model(nn_model) %>%
    add_formula(formula)

nn_fit_boot <- nn_wf %>%
    fit_resamples(resamples, control=control_resamples(save_pred=TRUE))
nn_fit_boot
boot_metrics <- collect_metrics(nn_fit_boot)

bind_rows(cv_metrics %>% mutate(model="Logistic regression"),
          boot_metrics %>% mutate(model="Nearest neighbor")) %>%
    select(model, mean, .metric) %>%
    pivot_wider(names_from=.metric, values_from=mean) %>%
    knitr::kable(digits = 3) %>%
    kableExtra::kable_styling(full_width=FALSE)
# Train a model on the full dataset
full_model <- nn_wf %>% fit(data)

boot_roc <- collect_predictions(nn_fit_boot) %>%
    roc_curve(truth=Personal.Loan, .pred_Yes, event_level="first")

ontrain_roc <- augment(full_model, new_data=data) %>%
    roc_curve(Personal.Loan, .pred_Yes, event_level="first")

ggplot() +
    geom_path(data=boot_roc, aes(x=1 - specificity, y=sensitivity)) +
    geom_path(data=ontrain_roc, aes(x=1 - specificity, y=sensitivity), color="red") +
    geom_path(data=cv_roc, aes(x=1 - specificity, y=sensitivity), color="grey") +
    geom_abline(lty=2)
set.seed(123)
nn_fit_boot <- nn_wf %>%
    fit_resamples(rsample::bootstraps(data, times=1000), control=control_resamples(save_pred=TRUE))
nn_fit_boot %>%
    collect_metrics()
nn_fit_boot %>%
    collect_metrics(summarize=FALSE) %>%
    head()
quantiles <- nn_fit_boot %>%
    collect_metrics(summarize=FALSE) %>%
    group_by(.metric) %>%
    summarize(
        q0.025 = quantile(.estimate, 0.025),
        median = quantile(.estimate, 0.5),
        q0.975 = quantile(.estimate, 0.975)
    )
nn_fit_boot %>%
    collect_metrics(summarize=FALSE) %>%
ggplot(aes(x=.estimate)) +
    geom_histogram(bins=50) +
    facet_wrap(~.metric, scales="free") +
    geom_vline(data=quantiles, aes(xintercept=median), color="blue") +
    geom_vline(data=quantiles, aes(xintercept=q0.025), color="blue", linetype="dashed") +
geom_vline(data=quantiles, aes(xintercept=q0.975), color="blue", linetype="dashed")This means, the fold was used as the validation set and the remaining folds were used for training.↩︎
Be careful for typos here. There is also the
broom::bootstrapfunction, which will give you a missing argument warning.↩︎This is for demonstration only! In practice, you would use the same validation approach for both models.↩︎