Chapter 11 Measuring performance of classification models
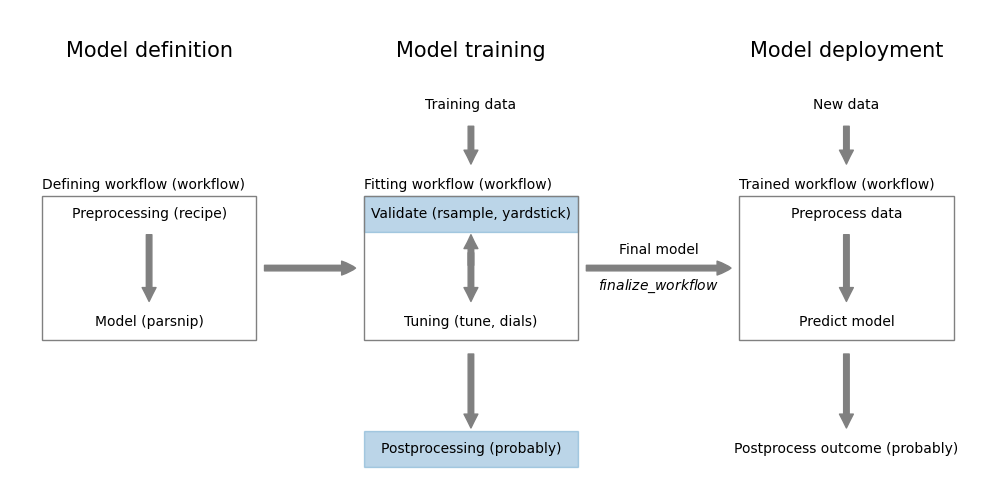
Figure 11.1: Measuring classification performance using yardstick
In Chapter 9, we learned how to use the yardstick package to measure the performance of a regression model. This package contains also a large collection of performance metrics for classification models.
We can divide the classification metrics into two types. The first type requires a hard, class prediction, these are called classification metrics in yardstick. The second type are metrics that consider the relationship between predicted probabilities and actual class. In yardstick, these are referred to as class probability metrics. Finally, yardstick provides a number of curves (e.g. ROC curves) that can be used to visualize the performance of a classification model.
In this chapter, we will also cover threshold selection using the probably package (Section 11.1.2).
Let’s demonstrate various measures using the logistic regression classification from the previous Chapter 10.
Code
Code
data <- read_csv("https://gedeck.github.io/DS-6030/datasets/UniversalBank.csv.gz")
data <- data %>%
select(-c(ID, `ZIP Code`)) %>%
rename(
Personal.Loan = `Personal Loan`,
Securities.Account = `Securities Account`,
CD.Account = `CD Account`
) %>%
mutate(
Personal.Loan = factor(Personal.Loan, labels=c("Yes", "No"), levels=c(1, 0)),
Education = factor(Education, labels=c("Undergrad", "Graduate", "Advanced")),
)
formula <- Personal.Loan ~ Income + Family + CCAvg + Education +
Mortgage + Securities.Account + CD.Account + Online +
CreditCard
model <- logistic_reg() %>%
set_engine("glm") %>%
fit(formula, data=data)
data <- augment(model, new_data=data)11.1 Classification metrics
The basis of classification metrics is the confusion matrix. The confusion matrix is a table that shows the number of correct and incorrect predictions made by a classification model. The confusion matrix is constructed as follows using yardstick::conf_mat:
## Truth
## Prediction Yes No
## Yes 323 49
## No 157 4471Here, the confusion matrix lists the predicted class in the rows and the actual class in the column. The diagonal elements are the correct predictions. The off-diagonal elements are the number of incorrect predictions. For example, we can see that the model predicted 49 Yes when the actual class was No.
The yardstick package provides an autoplot function for the confusion matrix (see 11.2). The type argument specifies the type of plot. The mosaic type gives a mosaic plot where areas represent the number of data points. The heatmap type is a heatmap.
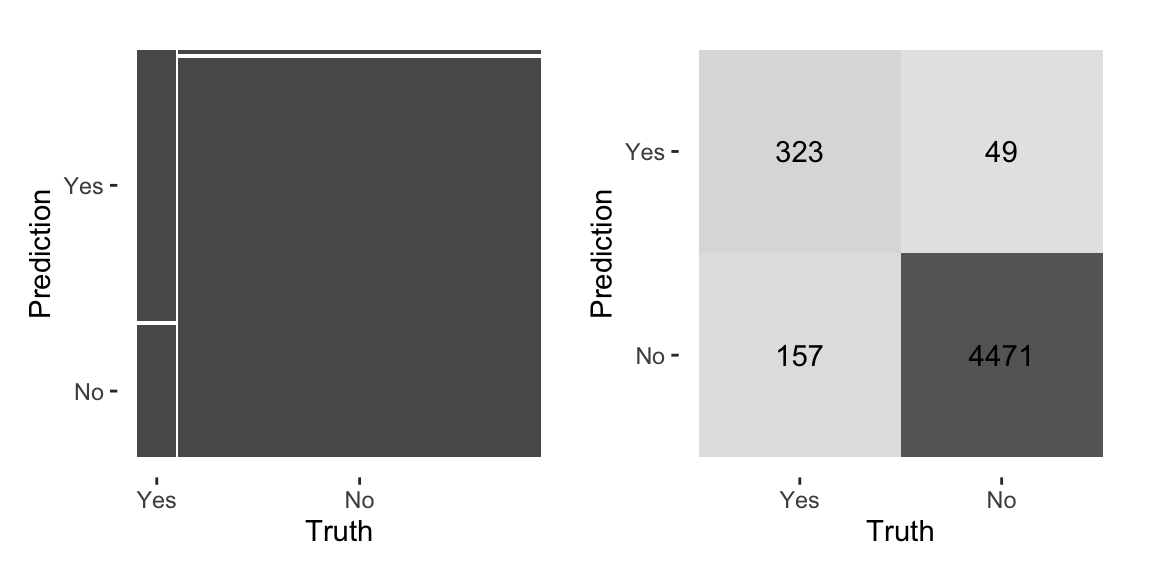
Figure 11.2: Visual representation of the confusion matrix using autoplot
Useful to know:
The definition of the confusion matrix is not standardized. There are other packages that swap the predicted and actual classes in the matrix. Always check which convention is used for the representation of the confusion matrix.
Using the confusion matrix, we can calculate various classification metrics. For example, the accuracy is the proportion of correct predictions.
## [1] 0.9588Accuracy is calculated as the sum of the diagonal divided by the total number of cases. Here, we get an accuracy of 0.9588. yardstick provides a large variety of metrics. The following calculates the accuracy using yardstick::accuracy:
## # A tibble: 1 × 3
## .metric .estimator .estimate
## <chr> <chr> <dbl>
## 1 accuracy binary 0.959Other metrics are:
sensitivity: Sensitivityspecificity: Specificityrecall: Recallprecision: Precisionmcc: Matthews correlation coefficientj_index: J-indexf_meas: F-measurekap: Kappappv: Positive predictive valuenpv: Negative predictive valuebal_accuracy: Balanced accuracydetection_prevalence: Detection prevalence
The function yardstick::metrics calculates two commonly used metrics accuracy and kappa:
## # A tibble: 2 × 3
## .metric .estimator .estimate
## <chr> <chr> <dbl>
## 1 accuracy binary 0.959
## 2 kap binary 0.736You can also define your own combination of metrics and use that to calculate multiple metrics at once.
Code
## # A tibble: 3 × 3
## .metric .estimator .estimate
## <chr> <chr> <dbl>
## 1 sens binary 0.673
## 2 spec binary 0.989
## 3 j_index binary 0.662Useful to know:
While you can rely on the default value picked by yardstick for the event of interest, it is good practice to specify the event of interest.
11.1.1 Specifying the event of interest
Metrics like accuracy, kap, or j_index treat both outcome classes equally important. However, in many cases, we are interested in the performance of the model for one of the classes. For example, in the case of a medical test, we are interested in the performance of the test for the positive class, i.e. the class that indicates the presence of a disease. Metrics like sensitivity or specificity have this dependency.
## # A tibble: 3 × 3
## .metric .estimator .estimate
## <chr> <chr> <dbl>
## 1 sens binary 0.673
## 2 spec binary 0.989
## 3 j_index binary 0.662Considering the confusion matrix,
## Truth
## Prediction Yes No
## Yes 323 49
## No 157 4471we can see that sensitivity, the true positive rate, was calculated for the Yes class;
\(323 / (323 + 157) = 0.6729167\).
specificity, the true negative rate, was calculated for the No class;
\(4471 / (49 + 4471) = 0.6729167\).
By default, yardstick assumes the that first level is the event of interest. In our example, the first level is Yes.
However, if we are interested in the No class, we can change this by specifying the event of interest using the event_level argument.
## # A tibble: 3 × 3
## .metric .estimator .estimate
## <chr> <chr> <dbl>
## 1 sens binary 0.989
## 2 spec binary 0.673
## 3 j_index binary 0.66211.1.2 Thresholds
In order to predict a class, we need to map the proability (or score) \(p\) calculated by a classification method to a class by applying a threshold.
\[\begin{equation} \textrm{class} = \begin{cases} \textrm{Yes} & \textrm{if } p > \textrm{threshold} \\ \textrm{No} & \textrm{otherwise} \end{cases} \end{equation}\]
The classification metrics are calculated using a threshold of 0.5. Using a different threshold, the confusion matrix and therefore all derived metrics change. Figure 11.3 demonstrates this using our example.
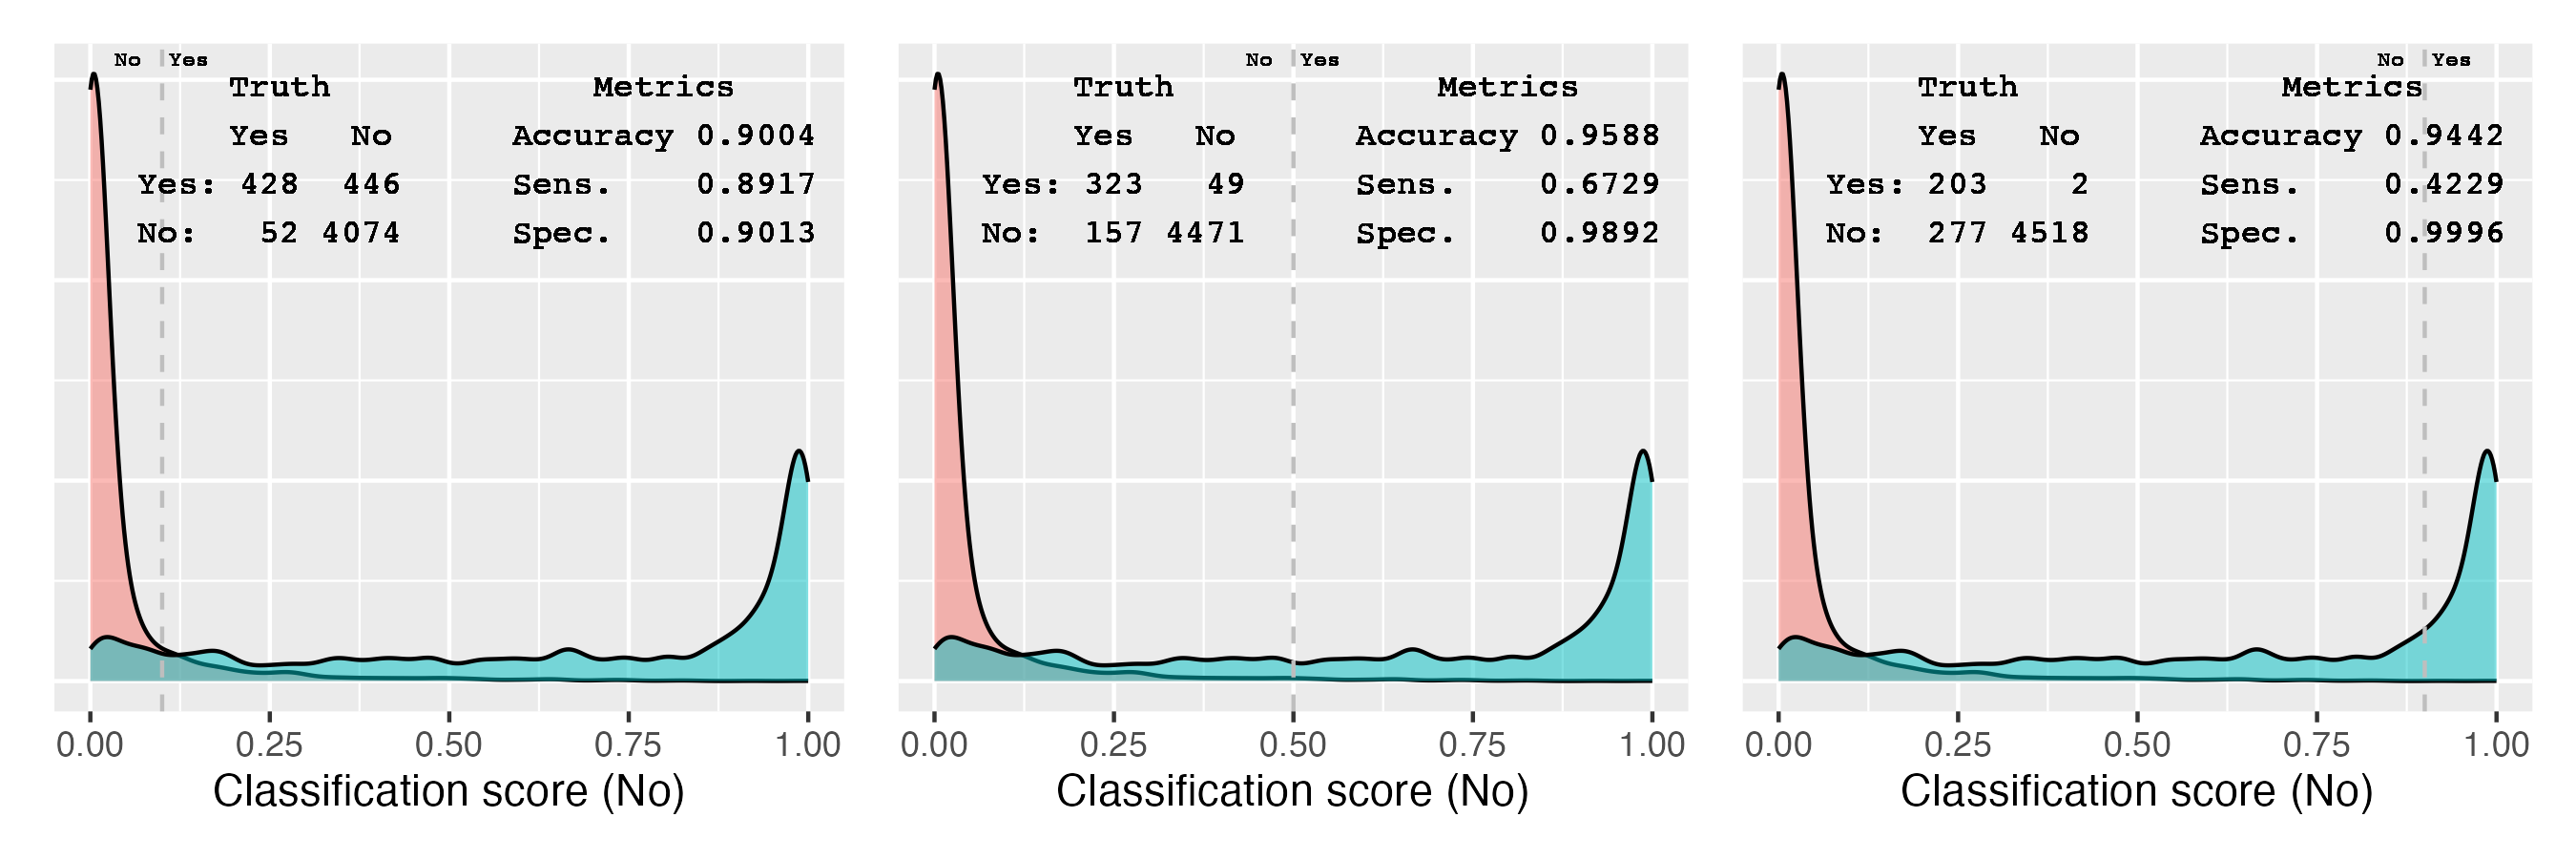
Figure 11.3: Relationship between threshold, confusion matrix, and various performance metrics
The two density plots show the distribution of the predicted probabilities for the two classes; blue for the Yes class and red for the No class. The vertical lines indicate the thresholds. The confusion matrix shows the number of cases predicted as Yes and No. Accuracy, sensitivity, and specificity are calculated for the three thresholds.
At the lowest threshold, 0.1, the model predicts most of the Yes cases as Yes, leading to the highest sensitivity of 0.8917. Increasing the threshold reduces the sensitivity, as more and more of the Yes cases are predicted as No. At the highest threshold, 0.9, the sensitivity is 0.4229. The specificity behaves in the opposite way. At the lowest threshold, the specificity is 0.9013. Increasing the threshold, more and more of the incorrectly classified No cases are now correctly predicted. At the highest threshold, the specificity is 0.9996.
Selecting the best threshold is a trade-off between sensitivity and specificity. The probably package provides a function to explore the relationship between thresholds and performance metrics. The function probably::threshold_perf calculates the performance metrics for a range of thresholds. The function returns a tibble with the threshold, the performance metric, and the estimate. We can use this tibble to plot the relationship between thresholds and performance metrics and determine a threshold based on a criteria of our choice. Figure 11.4 shows the relationship between thresholds and accuracy, sensitivity, and specificity.
Code
performance_1 <- probably::threshold_perf(data, Personal.Loan, .pred_Yes,
thresholds=seq(0.05, 0.95, 0.01), event_level="first",
metrics=metric_set(j_index, specificity, sensitivity))
performance_2 <- probably::threshold_perf(data, Personal.Loan, .pred_Yes,
thresholds=seq(0.05, 0.95, 0.01), event_level="first",
metrics=metric_set(accuracy, kap, bal_accuracy, f_meas))
max_j_index <- performance_1 %>%
filter(.metric == "j_index") %>%
filter(.estimate == max(.estimate))
max_performance <- performance_2 %>%
arrange(desc(.threshold)) %>%
group_by(.metric) %>%
filter(.estimate == max(.estimate)) %>%
filter(row_number() == 1)
g1 <- ggplot(performance_1, aes(x=.threshold, y=.estimate, color=.metric)) +
geom_line() +
geom_vline(data=max_j_index, aes(xintercept=.threshold, color=.metric)) +
scale_x_continuous(breaks=seq(0, 1, 0.1)) +
xlab("Threshold") + ylab("Metric value") +
theme(legend.position="inside", legend.position.inside = c(0.85, 0.75))
g2 <- ggplot(performance_2, aes(x=.threshold, y=.estimate, color=.metric)) +
geom_line() +
geom_vline(data=max_performance, aes(xintercept=.threshold, color=.metric)) +
scale_x_continuous(breaks=seq(0, 1, 0.1)) +
xlab("Threshold") + ylab("Metric value") +
theme(legend.position="inside", legend.position.inside=c(0.85, 0.75))
g1 + g2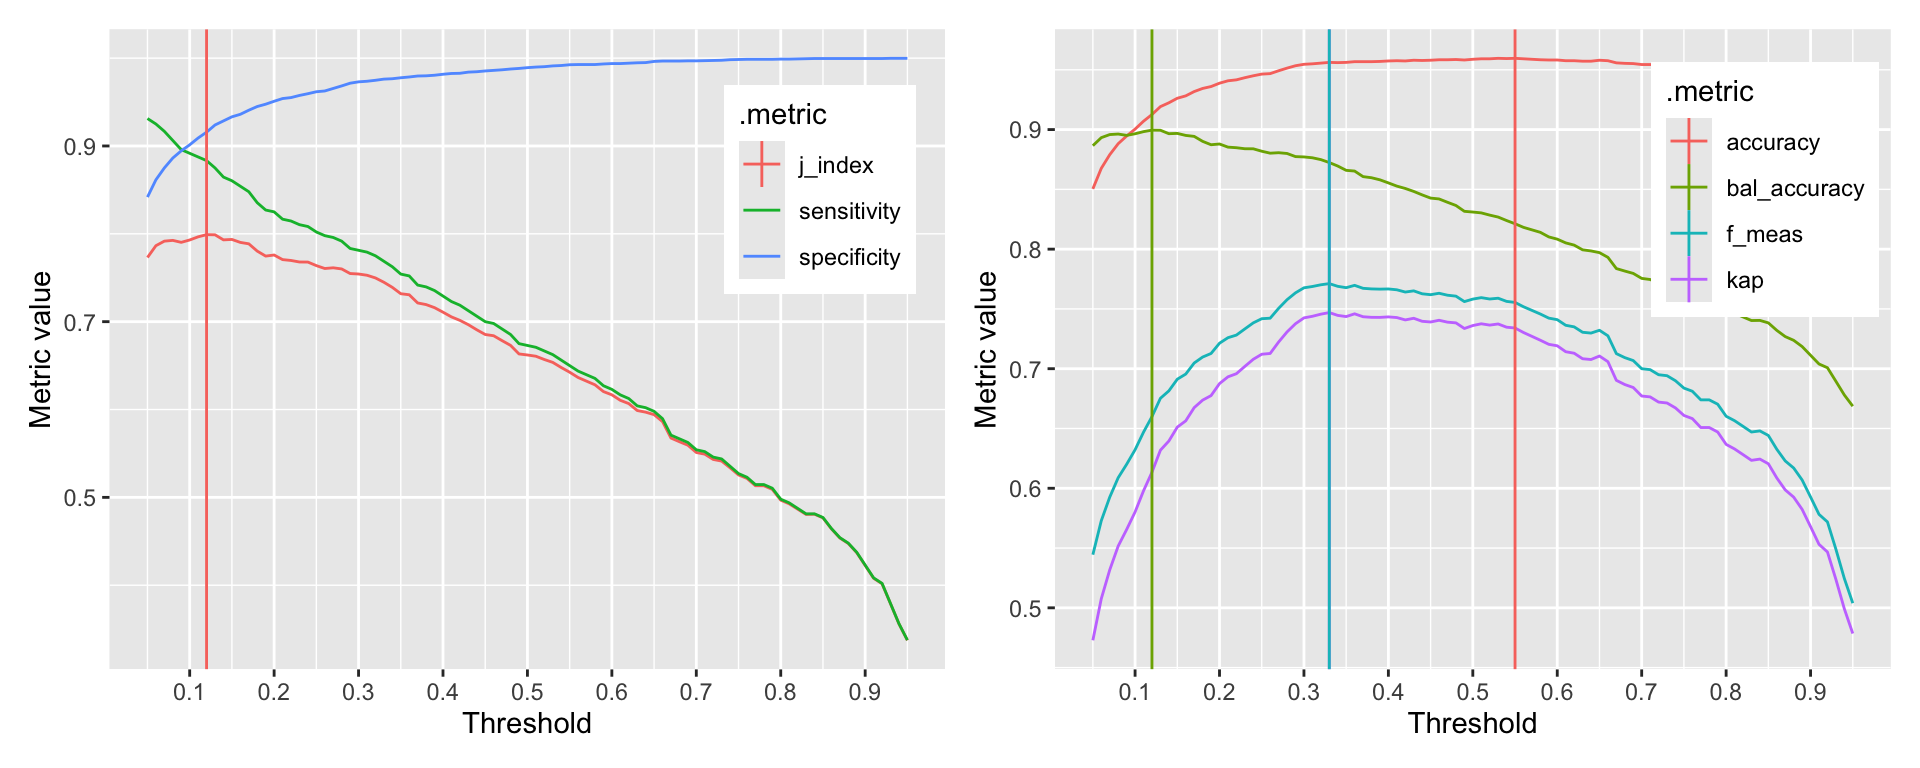
Figure 11.4: Relationship between threshold and sensitivity, specificity, and j-index
The probably::threshold_perf function takes a tibble and the names of the columns that contain the truth and the predicted probabilities. The thresholds argument specifies the range of thresholds to be explored. The metrics argument specifies the metrics to be calculated for each threshold. If you event of interest is not the first level, you can specify this using the event_level argument. Evaluating the performance metrics is very fast, so you can explore a large number of thresholds. Here, we explored 91 thresholds between 0.05 and 0.95.
The graphs clearly show that depending on the selected metric, the optimal threshold is different. The first graph shows the relationship between thresholds and the J-index, sensitivity, and specificity. The second graph shows the relationship between thresholds and accuracy, kappa, and balanced accuracy. The vertical lines indicate the optimal threshold for each metric. The optimal threshold for the J-index is 0.12. The optimal threshold for accuracy, kappa, and balanced accuracy is 0.55, 0.33, 0.33, 0.12.
Useful to know:
This section has shown you how to calculate classification metrics as a function of the threshold. In any project, you will need to decide which of all possible metrics is the most appropriate for your problem. Sometimes you want to be more risk averse and prefer a higher sensitivity or fewer false positives. Sometimes you can be more risk taking and prefer a higher specificity or fewer false negatives.
11.2 Class probability metrics
In the previous Chapter 10, we encountered AUC, the area under the ROC curve. This is an example of a class probability metric. The ROC curve shows the relationship between sensitivity and specificity for all possible thresholds.
A ROC curve can be constructed by calculating sensitivity and specificity at different thresholds and then plotting the relationship between sensitivity and specificity. Figure 11.5 demonstrates the construction of the ROC curve.
Code
performance <- probably::threshold_perf(data, Personal.Loan, .pred_Yes,
seq(0.00, 1.0, 0.1), event_level="first")
metrics <- pivot_wider(performance, id_cols=.threshold, names_from=.metric,
values_from=.estimate)
roc_curve(data, Personal.Loan, .pred_Yes, event_level="first") %>%
autoplot() +
geom_point(data=metrics, aes(x=1 - specificity, y=sensitivity), color="red") +
geom_text(data=metrics, aes(x=1 - specificity, y=sensitivity, label=.threshold),
nudge_x=0.05, check_overlap=TRUE)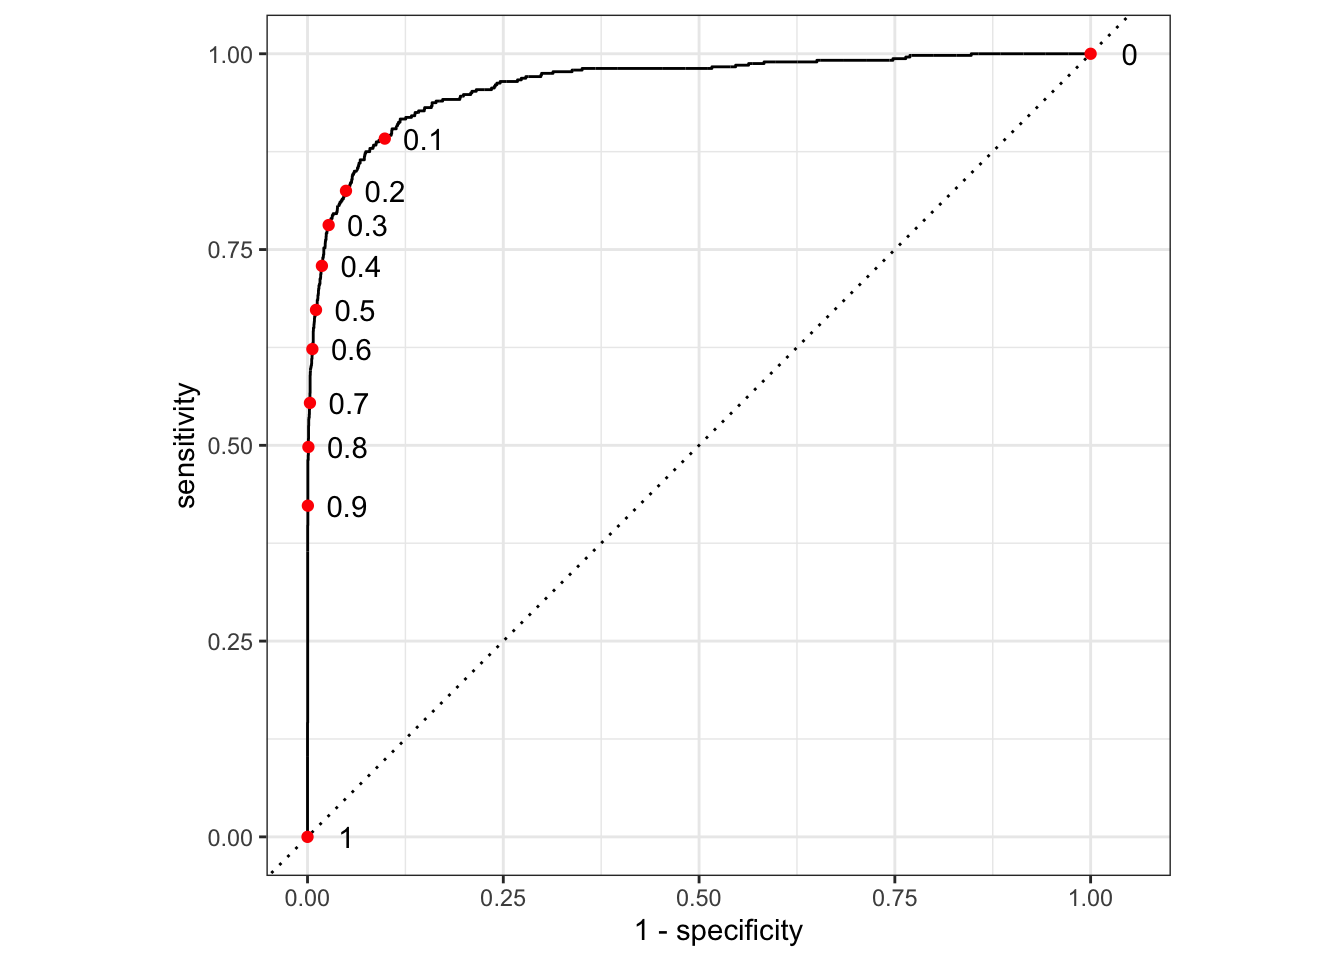
Figure 11.5: Construction of ROC curve
We first use threshold_perf to calculate the sensitivity and specificity for a range of thresholds. We then use pivot_wider to convert the tibble into a wide format.
In addition, we use the roc_curve function from yardstick to calculate the ROC curve and plot it first. The graph then overlays the results from the threshold_perf calculation as red points.
Useful to know:
In reality, calculating the ROC curves is a bit more complicated. In particular, care must be taken on how to resolve ties. The roc_curve function from yardstick uses the trapezoidal rule to calculate the area under the curve. For more information on how and why ties are important see (Muschelli 2020).
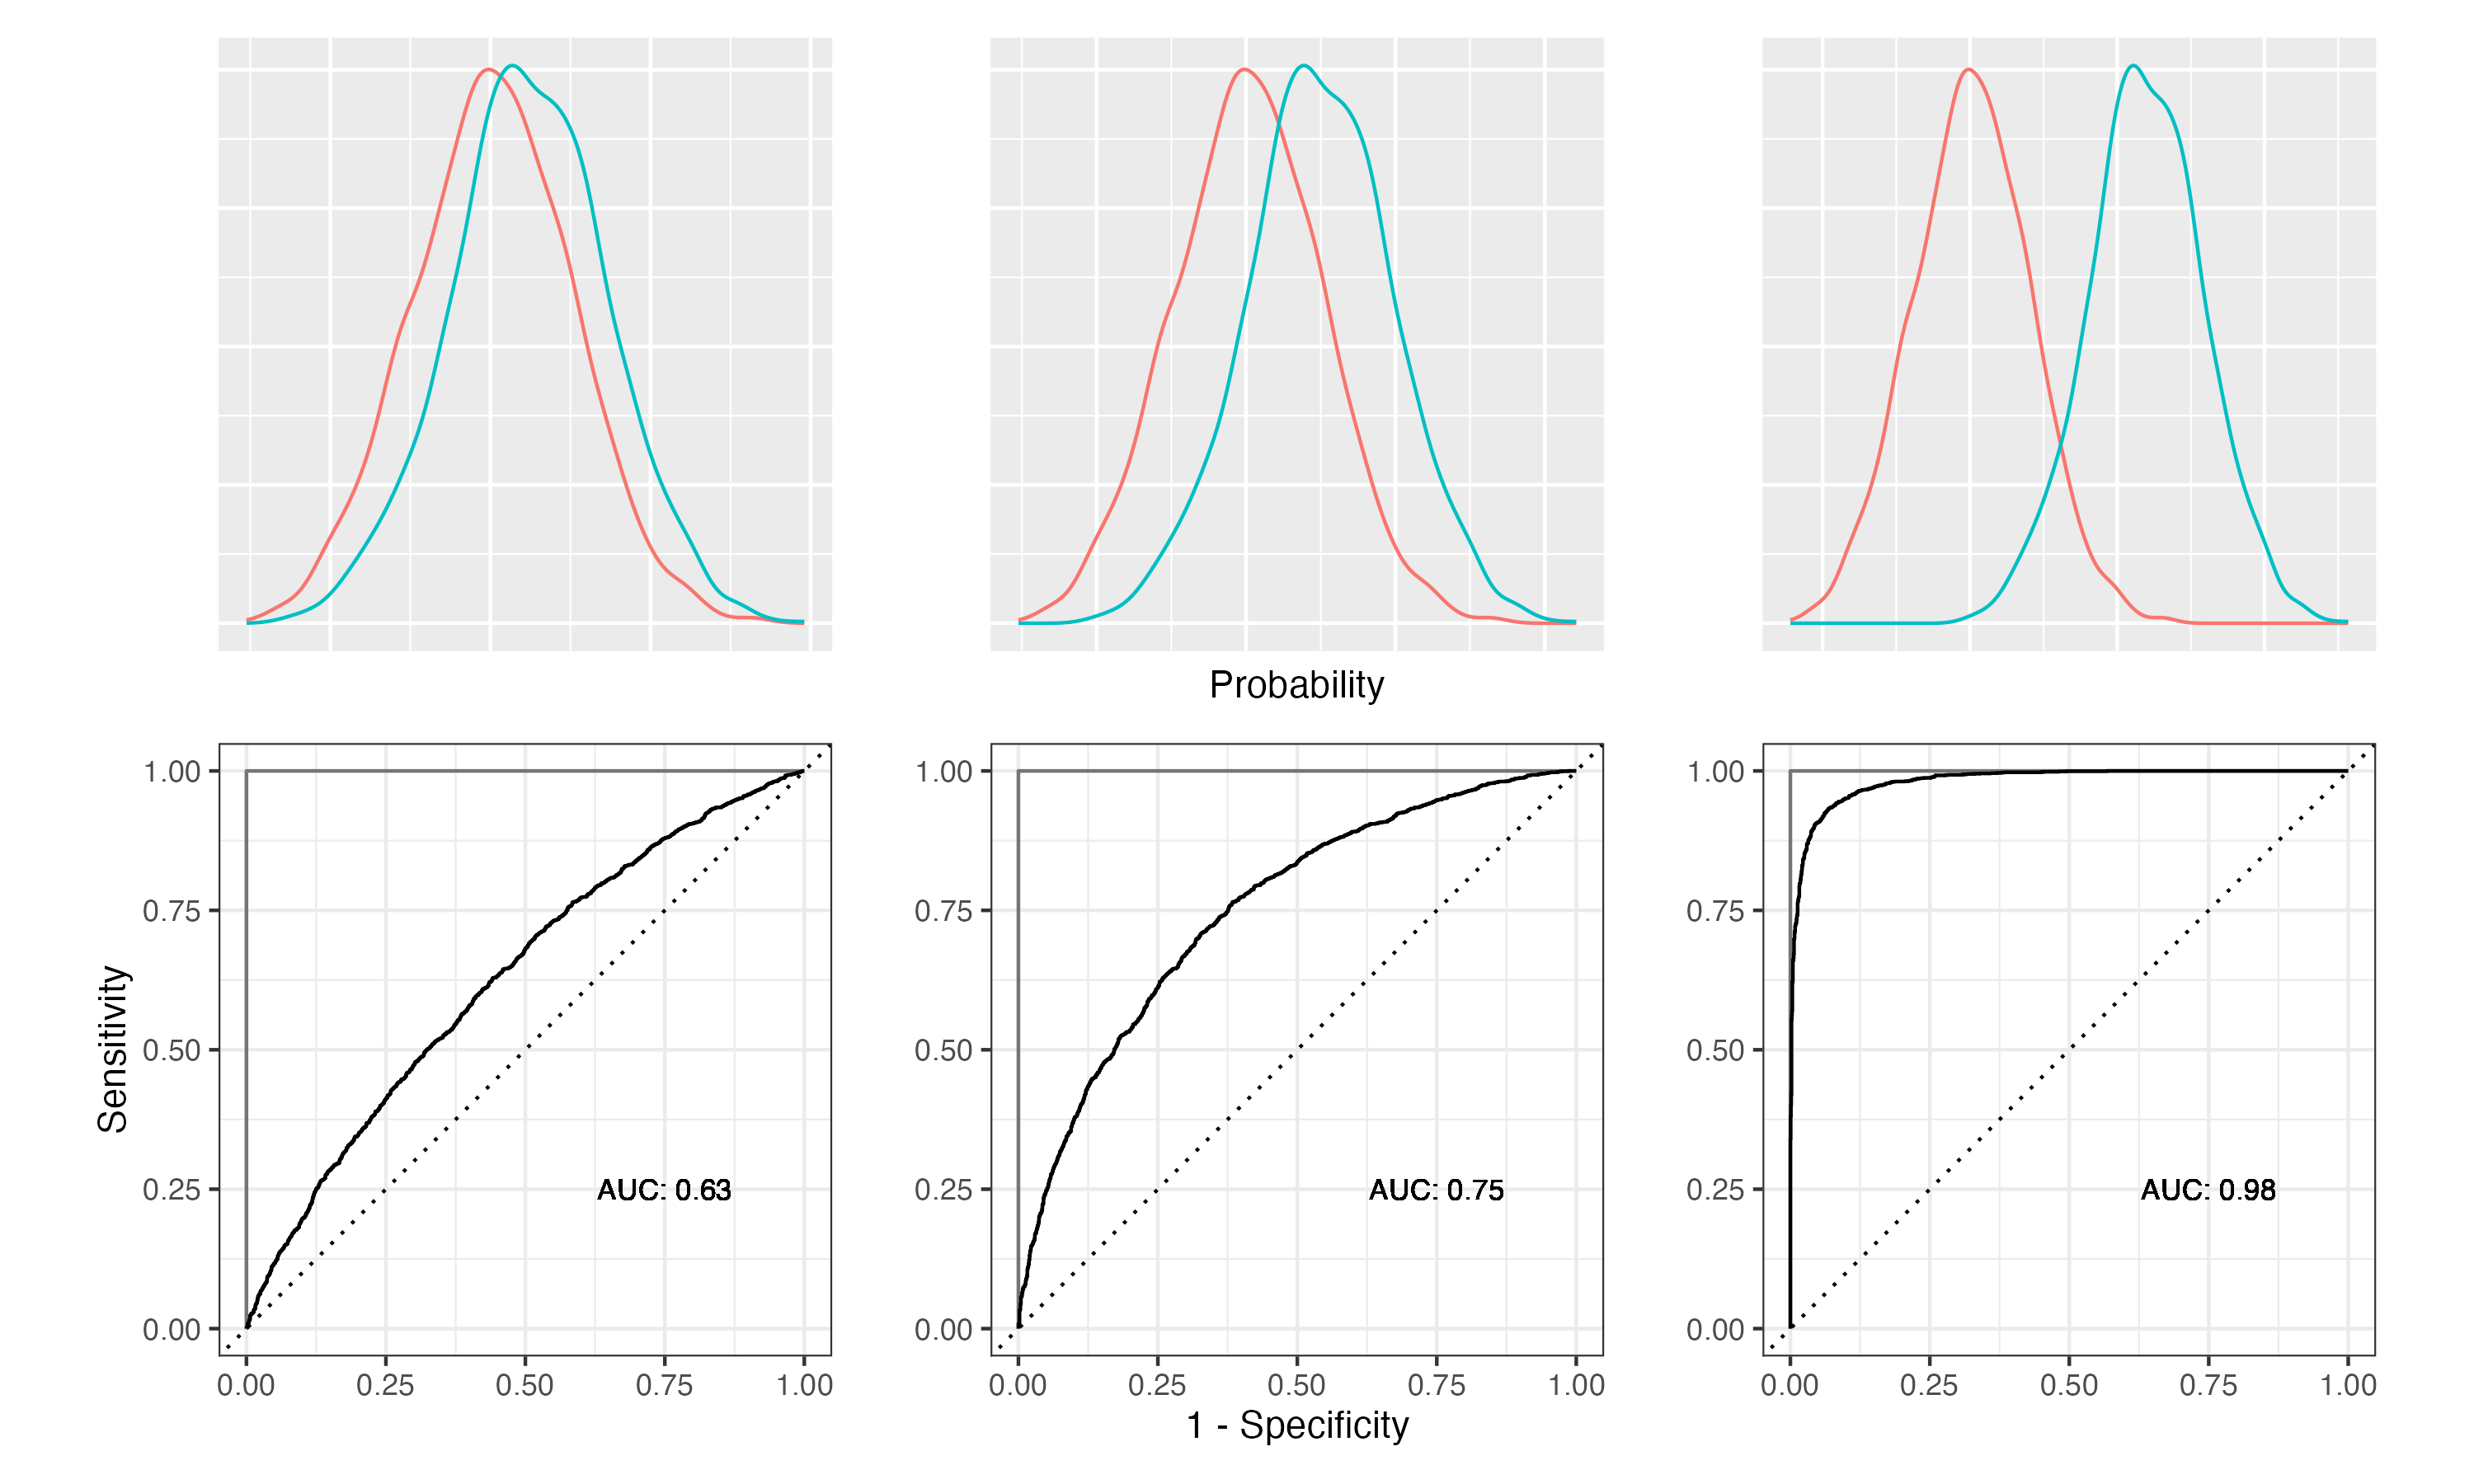
Figure 11.6: Relationship between class separation, ROC curves and AUC
![Interpretation of AUC [@trifonovaMetabolicProfilingHuman2014]](images/AUC-ROC.png)
Figure 11.7: Interpretation of AUC (Trifonova, Lokhov, and Archakov 2014)
Let’s calculate the AUC for our example.
## # A tibble: 1 × 3
## .metric .estimator .estimate
## <chr> <chr> <dbl>
## 1 roc_auc binary 0.962The roc_auc function requires the truth and the predicted probabilities. The event_level argument specifies the event of interest.
In our case, the AUC is 0.962. We have an excellent model.
Other class probability metrics are:
pr_auc: Area under the precision recall curveaverage_precision: Area under the precision recall curve (variation ofpr_auc)gain_capture: Gain capturemn_log_loss: Mean log loss for multinomial dataclassification_cost: Costs function for poor classificationbrier_class: Brier score for classification models
Code
## # A tibble: 7 × 3
## .metric .estimator .estimate
## <chr> <chr> <dbl>
## 1 roc_auc binary 0.962
## 2 pr_auc binary 0.851
## 3 average_precision binary 0.851
## 4 gain_capture binary 0.924
## 5 mn_log_loss binary 0.117
## 6 classification_cost binary 0.0652
## 7 brier_class binary 0.031711.3 Curves
In addition to the ROC curves, yardstick supports other curves. Figure 11.8 shows all curves supported by yardstick.
Code
g1 <- roc_curve(data, Personal.Loan, .pred_Yes, event_level="first") %>%
autoplot() + labs(title="ROC curve")
g2 <- gain_curve(data, Personal.Loan, .pred_Yes, event_level="first") %>%
autoplot() + labs(title="Gains curve")
g3 <- pr_curve(data, Personal.Loan, .pred_Yes, event_level="first") %>%
autoplot() + labs(title="Precision/recall")
g4 <- lift_curve(data, Personal.Loan, .pred_Yes, event_level="first") %>%
autoplot() + labs(title="Lift curve")
(g1 + g2) / (g3 + g4)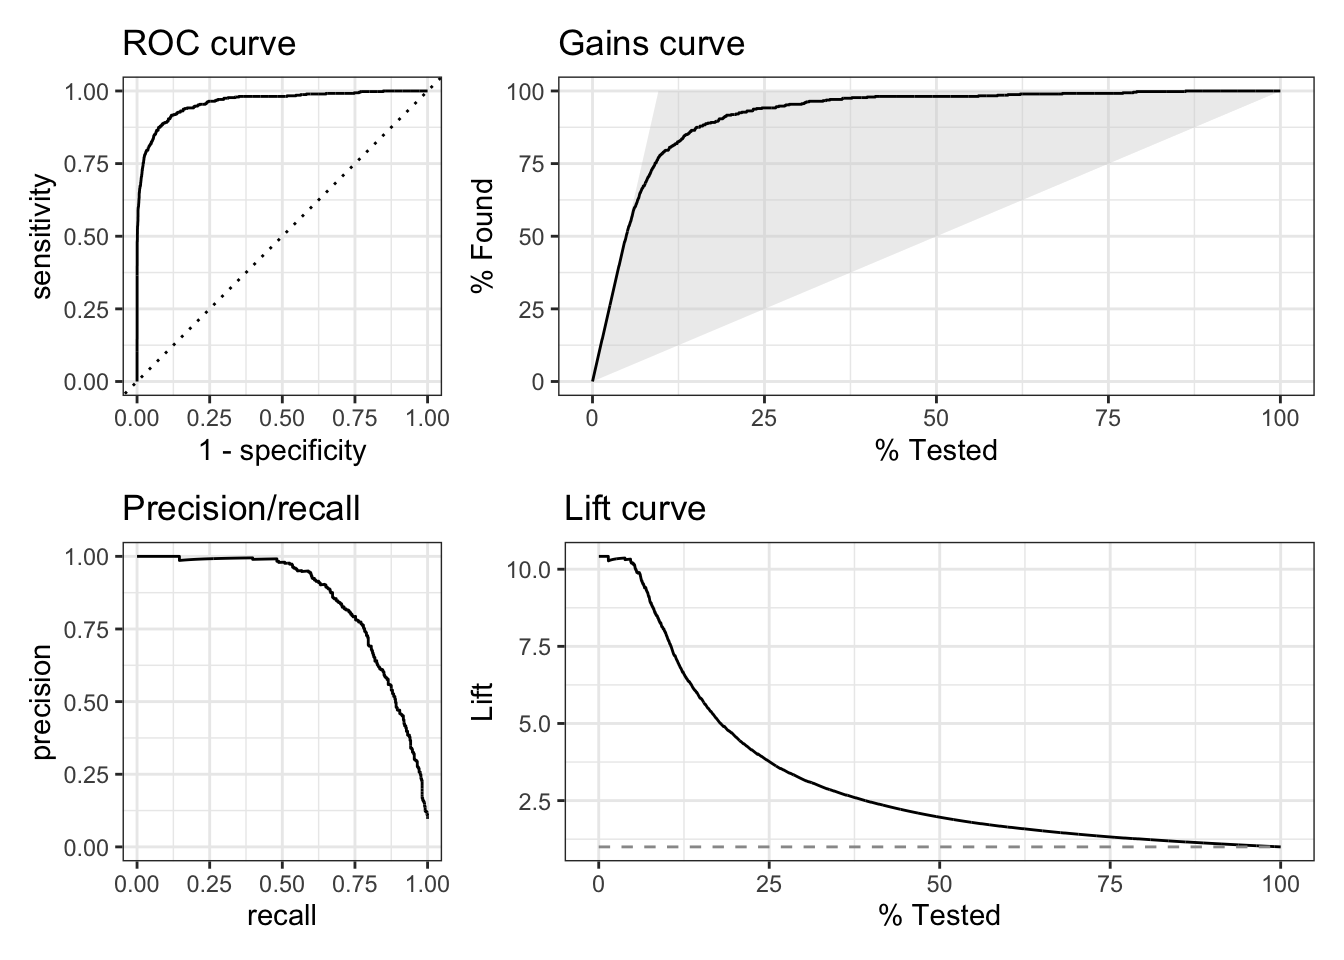
Figure 11.8: All curves supported by yardstick
The precision/recall curve plots precision against recall.
The gains curve is similar to the ROC curve, but instead of plotting sensitivity against specificity, it plots the cumulative number of true positives against the cumulative number of false positives. A gains curve focuses on what happens if you use the model to select a subset of the data based on the predicted probability. In our example, approaching 10% of the customers based on the predicted Yes score, will give us about 75% of the customers that would get a loan. A variation of this curve type incorporates cost. Figure 11.9 shows an example. The benefit of a correct classification is offset by the cost of missclassifications. Looking a the curve from left to right, we see that initially, the benefit of correct classifications outweighs the cost of missclassifications. However, at some point, the cost of missclassifications outweighs the benefit of correct classifications and ultimately, the cost leads to a negative outcome. The optimal point is where the curve is the highest.![Cumulative gains curve incorporating costs [@MachineLearningBusiness2023]](images/c5f012.png)
Figure 11.9: Cumulative gains curve incorporating costs (Shmueli et al. 2023)
The lift curve is another way of looking at selecting a subset based on the predicted score/probability. The curve tells you how much better (or worse) the model performs compared to random. In our example, we see that the lift for first 10% of the customers is between 7 and 10. This means that the model is 7 to 10 times better than random.
Todo:
Look through the manual for yardstick to get an overview of all available classification metrics.
Code
The code of this chapter is summarized here.
Code
knitr::opts_chunk$set(echo=TRUE, cache=TRUE, autodep=TRUE, fig.align="center")
knitr::include_graphics("images/model_workflow_postprocessing.png")
library(tidyverse)
library(tidymodels)
library(yardstick)
library(probably)  # for exploring thresholds
library(patchwork) # for combining plots
data <- read_csv("https://gedeck.github.io/DS-6030/datasets/UniversalBank.csv.gz")
data <- data %>%
    select(-c(ID, `ZIP Code`)) %>%
    rename(
        Personal.Loan = `Personal Loan`,
        Securities.Account = `Securities Account`,
        CD.Account = `CD Account`
    ) %>%
    mutate(
        Personal.Loan = factor(Personal.Loan, labels=c("Yes", "No"), levels=c(1, 0)),
        Education = factor(Education, labels=c("Undergrad", "Graduate", "Advanced")),
    )
formula <- Personal.Loan ~ Income + Family + CCAvg + Education +
                           Mortgage + Securities.Account + CD.Account + Online +
                           CreditCard
model <- logistic_reg() %>%
    set_engine("glm") %>%
    fit(formula, data=data)
data <- augment(model, new_data=data)
cm <- data %>%
    conf_mat(truth=Personal.Loan, estimate=.pred_class)
cm
g1 <- autoplot(cm, type = "mosaic")
g2 <- autoplot(cm, type = "heatmap")
g1 + g2
(cm$table[1, 1] + cm$table[2, 2]) / sum(cm$table)
yardstick::accuracy(data, truth=Personal.Loan, estimate=.pred_class)
yardstick::metrics(data, Personal.Loan, .pred_class)
my_metrics <- metric_set(sens, spec, j_index)
my_metrics(data, truth=Personal.Loan, estimate=.pred_class)
my_metrics(data, truth=Personal.Loan, estimate=.pred_class)
conf_mat(data, truth=Personal.Loan, estimate=.pred_class)
my_metrics(data, truth=Personal.Loan, estimate=.pred_class, event_level="second")
knitr::include_graphics("images/threshold-accuracy.png")
performance <- probably::threshold_perf(data, Personal.Loan, .pred_Yes,
c(0.1, 0.5, 0.9), event_level="first",
metrics=yardstick::metric_set(yardstick::accuracy, yardstick::specificity,
yardstick::sensitivity))
perf_1 <- performance %>% filter(.threshold == 0.1)
perf_5 <- performance %>% filter(.threshold == 0.5)
perf_9 <- performance %>% filter(.threshold == 0.9)
performance_1 <- probably::threshold_perf(data, Personal.Loan, .pred_Yes,
    thresholds=seq(0.05, 0.95, 0.01), event_level="first",
    metrics=metric_set(j_index, specificity, sensitivity))
performance_2 <- probably::threshold_perf(data, Personal.Loan, .pred_Yes,
    thresholds=seq(0.05, 0.95, 0.01), event_level="first",
    metrics=metric_set(accuracy, kap, bal_accuracy, f_meas))
max_j_index <- performance_1 %>%
    filter(.metric == "j_index") %>%
    filter(.estimate == max(.estimate))
max_performance <- performance_2 %>%
    arrange(desc(.threshold)) %>%
    group_by(.metric) %>%
    filter(.estimate == max(.estimate)) %>%
    filter(row_number() == 1)

g1 <- ggplot(performance_1, aes(x=.threshold, y=.estimate, color=.metric)) +
    geom_line() +
    geom_vline(data=max_j_index, aes(xintercept=.threshold, color=.metric)) +
    scale_x_continuous(breaks=seq(0, 1, 0.1)) +
    xlab("Threshold") + ylab("Metric value") +
    theme(legend.position="inside", legend.position.inside = c(0.85, 0.75))
g2 <- ggplot(performance_2, aes(x=.threshold, y=.estimate, color=.metric)) +
    geom_line() +
    geom_vline(data=max_performance, aes(xintercept=.threshold, color=.metric)) +
    scale_x_continuous(breaks=seq(0, 1, 0.1)) +
    xlab("Threshold") + ylab("Metric value") +
    theme(legend.position="inside", legend.position.inside=c(0.85, 0.75))
g1 + g2
performance <- probably::threshold_perf(data, Personal.Loan, .pred_Yes,
                                        seq(0.00, 1.0, 0.1), event_level="first")
metrics <- pivot_wider(performance, id_cols=.threshold, names_from=.metric,
                       values_from=.estimate)
roc_curve(data, Personal.Loan, .pred_Yes, event_level="first") %>%
    autoplot() +
    geom_point(data=metrics, aes(x=1 - specificity, y=sensitivity), color="red") +
    geom_text(data=metrics, aes(x=1 - specificity, y=sensitivity, label=.threshold),
              nudge_x=0.05, check_overlap=TRUE)
knitr::include_graphics("images/roc-auc-class-separation.png")
knitr::include_graphics("images/AUC-ROC.png")
roc_auc(data, Personal.Loan, .pred_Yes, event_level="first")
prob_metrics <- metric_set(roc_auc, pr_auc, average_precision, gain_capture,
                           mn_log_loss, classification_cost, brier_class)
prob_metrics(data, Personal.Loan, .pred_Yes)
g1 <- roc_curve(data, Personal.Loan, .pred_Yes, event_level="first") %>%
    autoplot() + labs(title="ROC curve")
g2 <- gain_curve(data, Personal.Loan, .pred_Yes, event_level="first") %>%
    autoplot() + labs(title="Gains curve")
g3 <- pr_curve(data, Personal.Loan, .pred_Yes, event_level="first") %>%
    autoplot() + labs(title="Precision/recall")
g4 <- lift_curve(data, Personal.Loan, .pred_Yes, event_level="first") %>%
    autoplot() + labs(title="Lift curve")

(g1 + g2) / (g3 + g4)
knitr::include_graphics("images/c5f012.png")