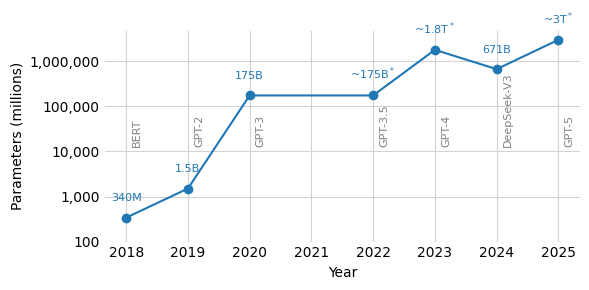
data = pd.DataFrame({
    "Year": [2018, 2019, 2020, 2022, 2023, 2024, 2025],
    "Model": ["BERT", "GPT-2", "GPT-3", "GPT-3.5", "GPT-4", "DeepSeek-V3",
        "GPT-5"],
    "Parameters": [340, 1_500, 175_000, 175_000, 1_800_000, 671_000, 3_000_000],
    "sParameters": ["340M", "1.5B", "175B", "~175B$^*$", "~1.8T$^*$", "671B", "~3T$^*$"],
})
fig, ax = plt.subplots(figsize=[6, 3])
data.plot(x="Year", y="Parameters", c="C0", ax=ax)
ax.scatter(data["Year"], data["Parameters"], c="C0", zorder=10)
ax.legend().remove()
ax.set_frame_on(False)

ax.set_yscale("log")
ax.set_xticks(range(min(data["Year"]), max(data["Year"]) + 1))
yticks = [1e2, 1e3, 1e4, 1e5, 1e6]
ax.set_yticks(yticks)
ax.set_yticklabels([f"{yt:,.0f}" for yt in yticks])
ax.tick_params(axis="both", which="both", length=0)
# ax.set_yticklabels(["100", "1,000", "10,000", "100,000", "1,000,000"])
for _, row in data.iterrows():
    ax.annotate(f"{row['sParameters']}", (row["Year"], row["Parameters"]),
                textcoords="offset points", xytext=(0, 12), ha="center",
                fontsize=8, c="C0")
    ax.annotate(f"{row['Model']}", (row["Year"], 10_000),
                textcoords="offset points", xytext=(8, 5),
                ha="center", transform_rotates_text=True, rotation=90,
                fontsize=8, c="grey")
ax.yaxis.set_minor_locator(ticker.NullLocator())
ax.set_xlabel("Year")
ax.set_ylabel("Parameters (millions)")
plt.grid(c="lightgrey")
plt.tight_layout()

plt.tight_layout()
plt.show()